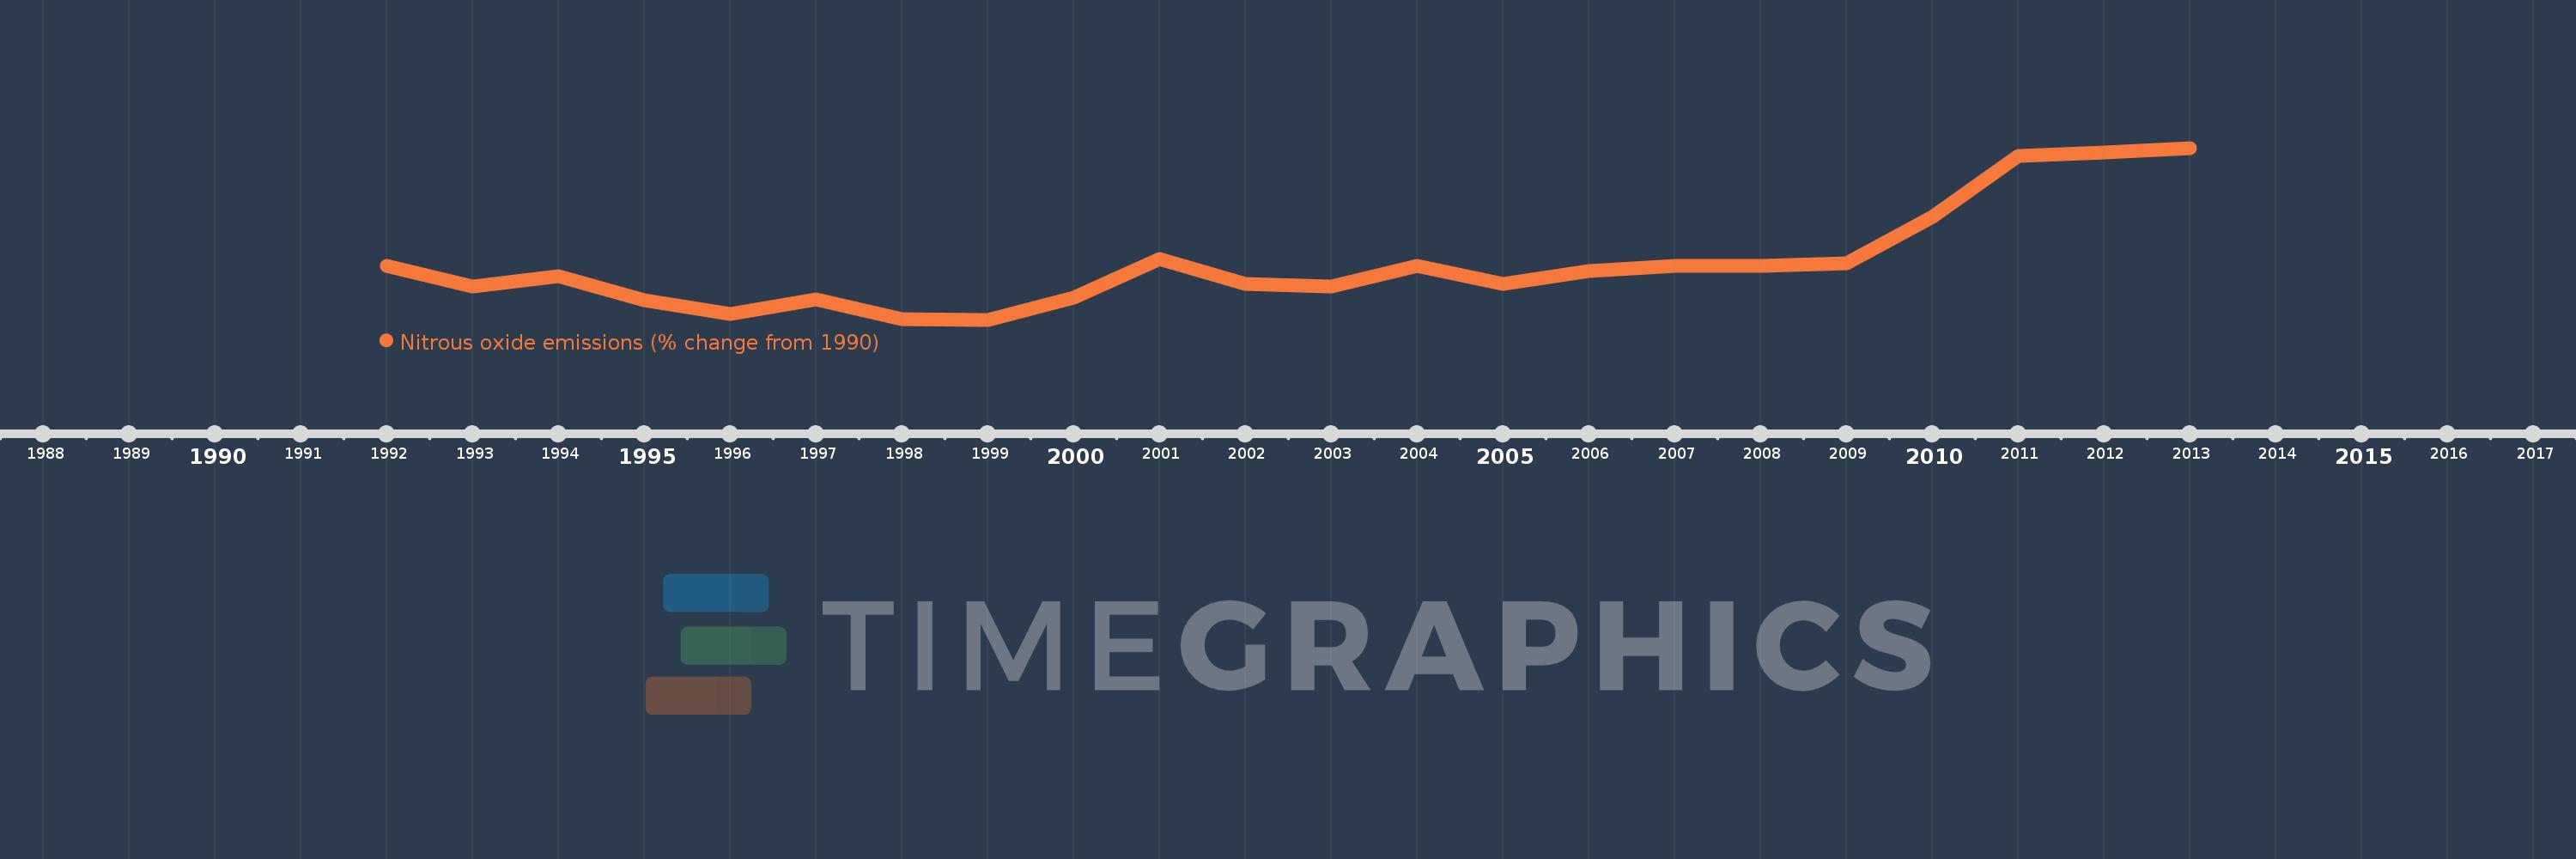
Questa scala temporale mostra un grafico dal 1992 anno al 2013 anno. Belize. I dati fino ad 1991 anno non disponibili. Il numero di osservazioni attuali secondo i date: 22.
La fonte (nome):
Indicatori dello sviluppo mondiale
La fonte (organizzazione):
World Bank staff estimates from original source: European Commission, Joint Research Centre (JRC)/Netherlands Environmental Assessment Agency (PBL). Emission Database for Global Atmospheric Research (EDGAR): http://edgar.jrc.ec.europa.eu/.
Categorie:
Climate Change, Environment
sono stati aggiornati
23 apr 2017 anni
Indicatori delle variazioni dei valori per anni
In media:
11.939
Minima:
-8.683
1 gen 1999 anni
Massimo:
54.347
1 gen 2013 anni
Alla data di osservazione
Valore
Variazione assoluta
La variazione rispetto al valore precedente
1 gen 1992 anni
10.941
+10.941
0.0%
1 gen 1993 anni
3.369
-7.572
-69.21%
1 gen 1994 anni
7.278
+3.909
116.04%
1 gen 1995 anni
-1.413
-8.691
-119.42%
1 gen 1996 anni
-6.654
-5.241
370.83%
1 gen 1997 anni
-1.289
+5.365
-80.63%
1 gen 1998 anni
-8.404
-7.115
551.97%
1 gen 1999 anni
-8.683
-0.279
3.32%
1 gen 2000 anni
-0.487
+8.197
-94.4%
1 gen 2001 anni
13.496
+13.983
-2.87 Mille.%
1 gen 2002 anni
4.414
-9.082
-67.3%
1 gen 2003 anni
3.452
-0.962
-21.8%
1 gen 2004 anni
10.957
+7.506
217.44%
1 gen 2005 anni
4.567
-6.391
-58.32%
1 gen 2006 anni
9.239
+4.673
102.32%
1 gen 2007 anni
10.997
+1.758
19.03%
1 gen 2008 anni
11.157
+0.16
1.45%
1 gen 2009 anni
12.163
+1.006
9.02%
1 gen 2010 anni
29.063
+16.9
138.94%
1 gen 2011 anni
51.32
+22.257
76.58%
1 gen 2012 anni
52.833
+1.513
2.95%
1 gen 2013 anni
54.347
+1.513
2.86%
Classificazione dei paesi secondo i statistiche attuali per anni