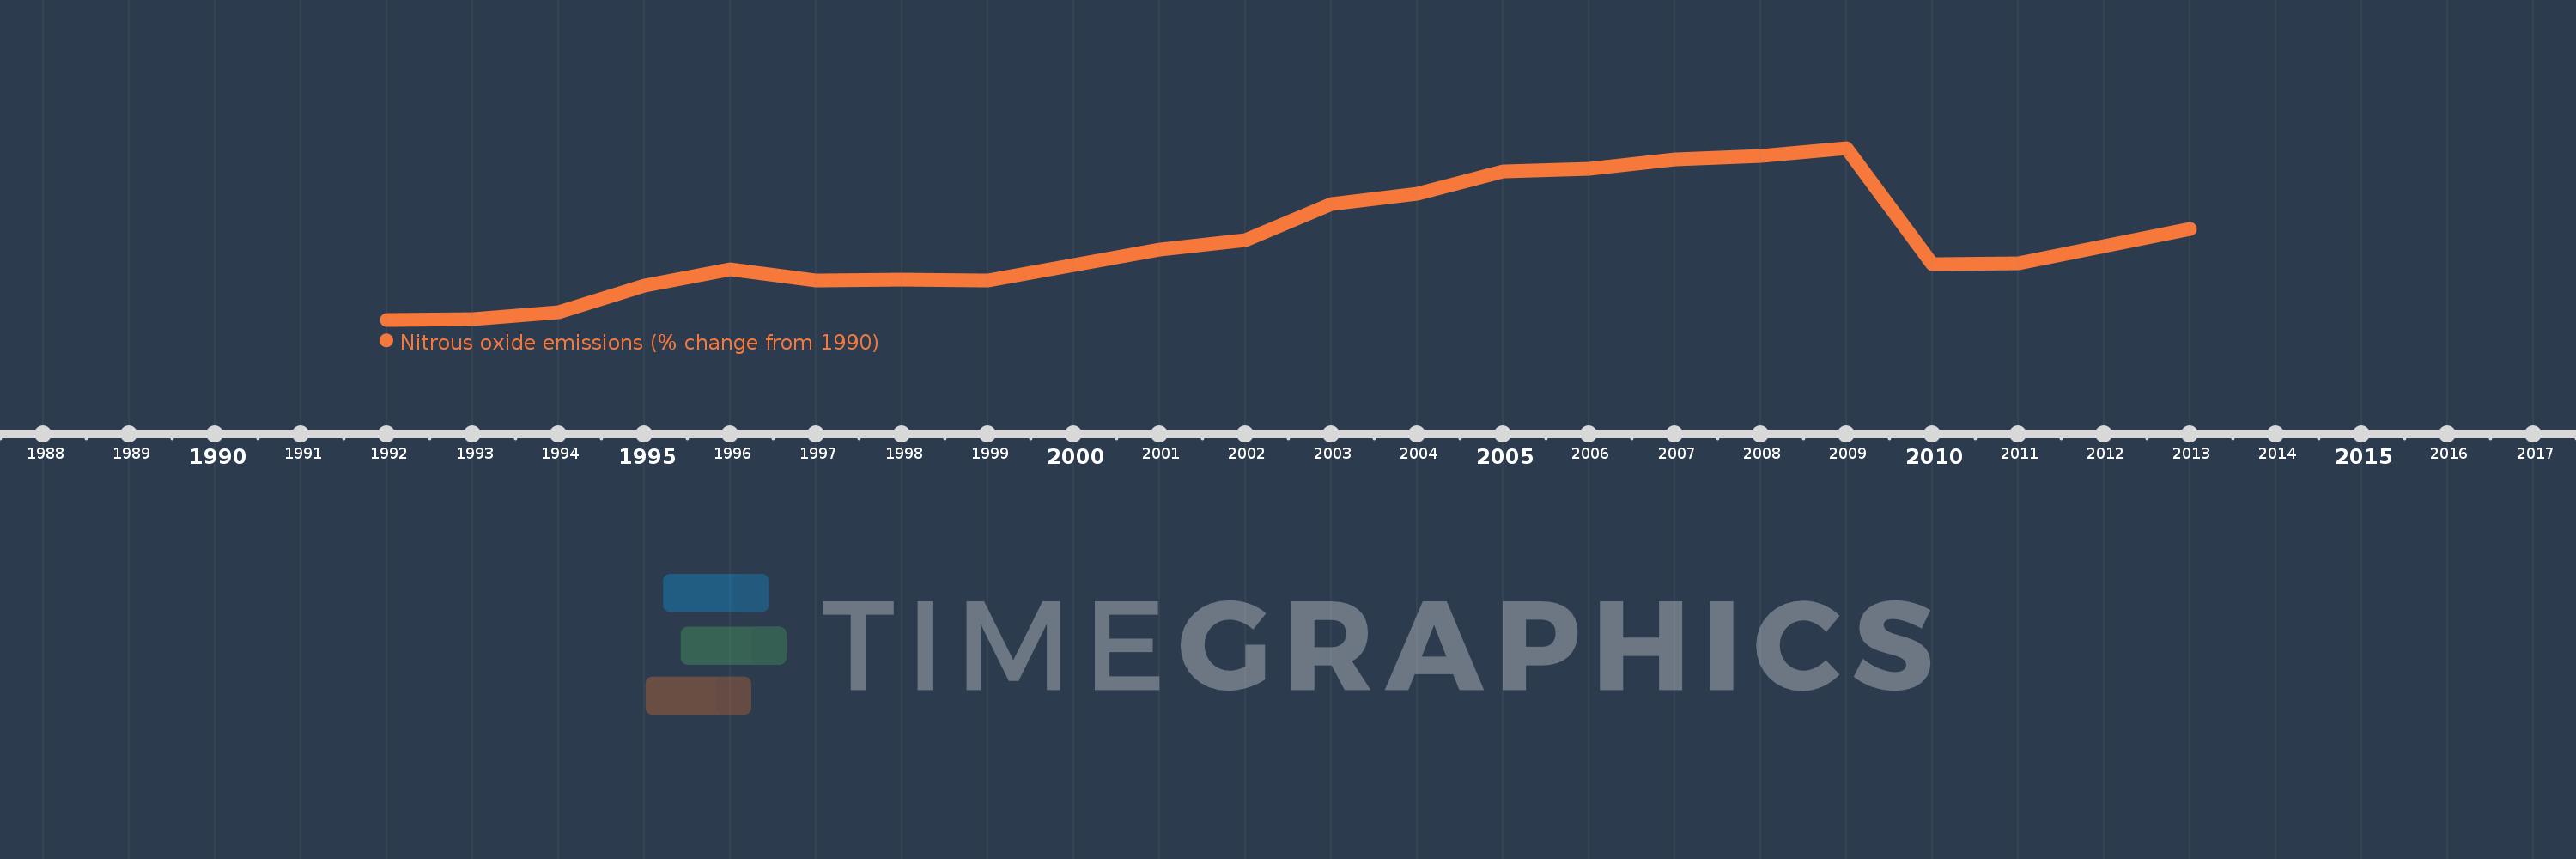
Questa scala temporale mostra un grafico dal 1992 anno al 2013 anno. New Zealand. I dati fino ad 1991 anno non disponibili. Il numero di osservazioni attuali secondo i date: 22.
La fonte (nome):
Indicatori dello sviluppo mondiale
La fonte (organizzazione):
World Bank staff estimates from original source: European Commission, Joint Research Centre (JRC)/Netherlands Environmental Assessment Agency (PBL). Emission Database for Global Atmospheric Research (EDGAR): http://edgar.jrc.ec.europa.eu/.
Categorie:
Climate Change, Environment
sono stati aggiornati
23 apr 2017 anni
Indicatori delle variazioni dei valori per anni
In media:
11.169
Minima:
-0.957
1 gen 1992 anni
Massimo:
25.583
1 gen 2009 anni
Alla data di osservazione
Valore
Variazione assoluta
La variazione rispetto al valore precedente
1 gen 1992 anni
-0.957
-0.957
0.0%
1 gen 1993 anni
-0.893
+0.065
-6.75%
1 gen 1994 anni
0.152
+1.044
-116.98%
1 gen 1995 anni
4.288
+4.137
2.73 Mille.%
1 gen 1996 anni
6.854
+2.566
59.83%
1 gen 1997 anni
5.151
-1.703
-24.84%
1 gen 1998 anni
5.27
+0.119
2.31%
1 gen 1999 anni
5.06
-0.21
-3.98%
1 gen 2000 anni
7.431
+2.37
46.84%
1 gen 2001 anni
9.871
+2.44
32.83%
1 gen 2002 anni
11.278
+1.407
14.26%
1 gen 2003 anni
16.905
+5.627
49.9%
1 gen 2004 anni
18.447
+1.542
9.12%
1 gen 2005 anni
21.911
+3.464
18.78%
1 gen 2006 anni
22.337
+0.426
1.94%
1 gen 2007 anni
23.839
+1.502
6.72%
1 gen 2008 anni
24.318
+0.478
2.01%
1 gen 2009 anni
25.583
+1.265
5.2%
1 gen 2010 anni
7.692
-17.891
-69.93%
1 gen 2011 anni
7.82
+0.129
1.67%
1 gen 2012 anni
10.354
+2.533
32.39%
1 gen 2013 anni
13.016
+2.662
25.71%
Classificazione dei paesi secondo i statistiche attuali per anni