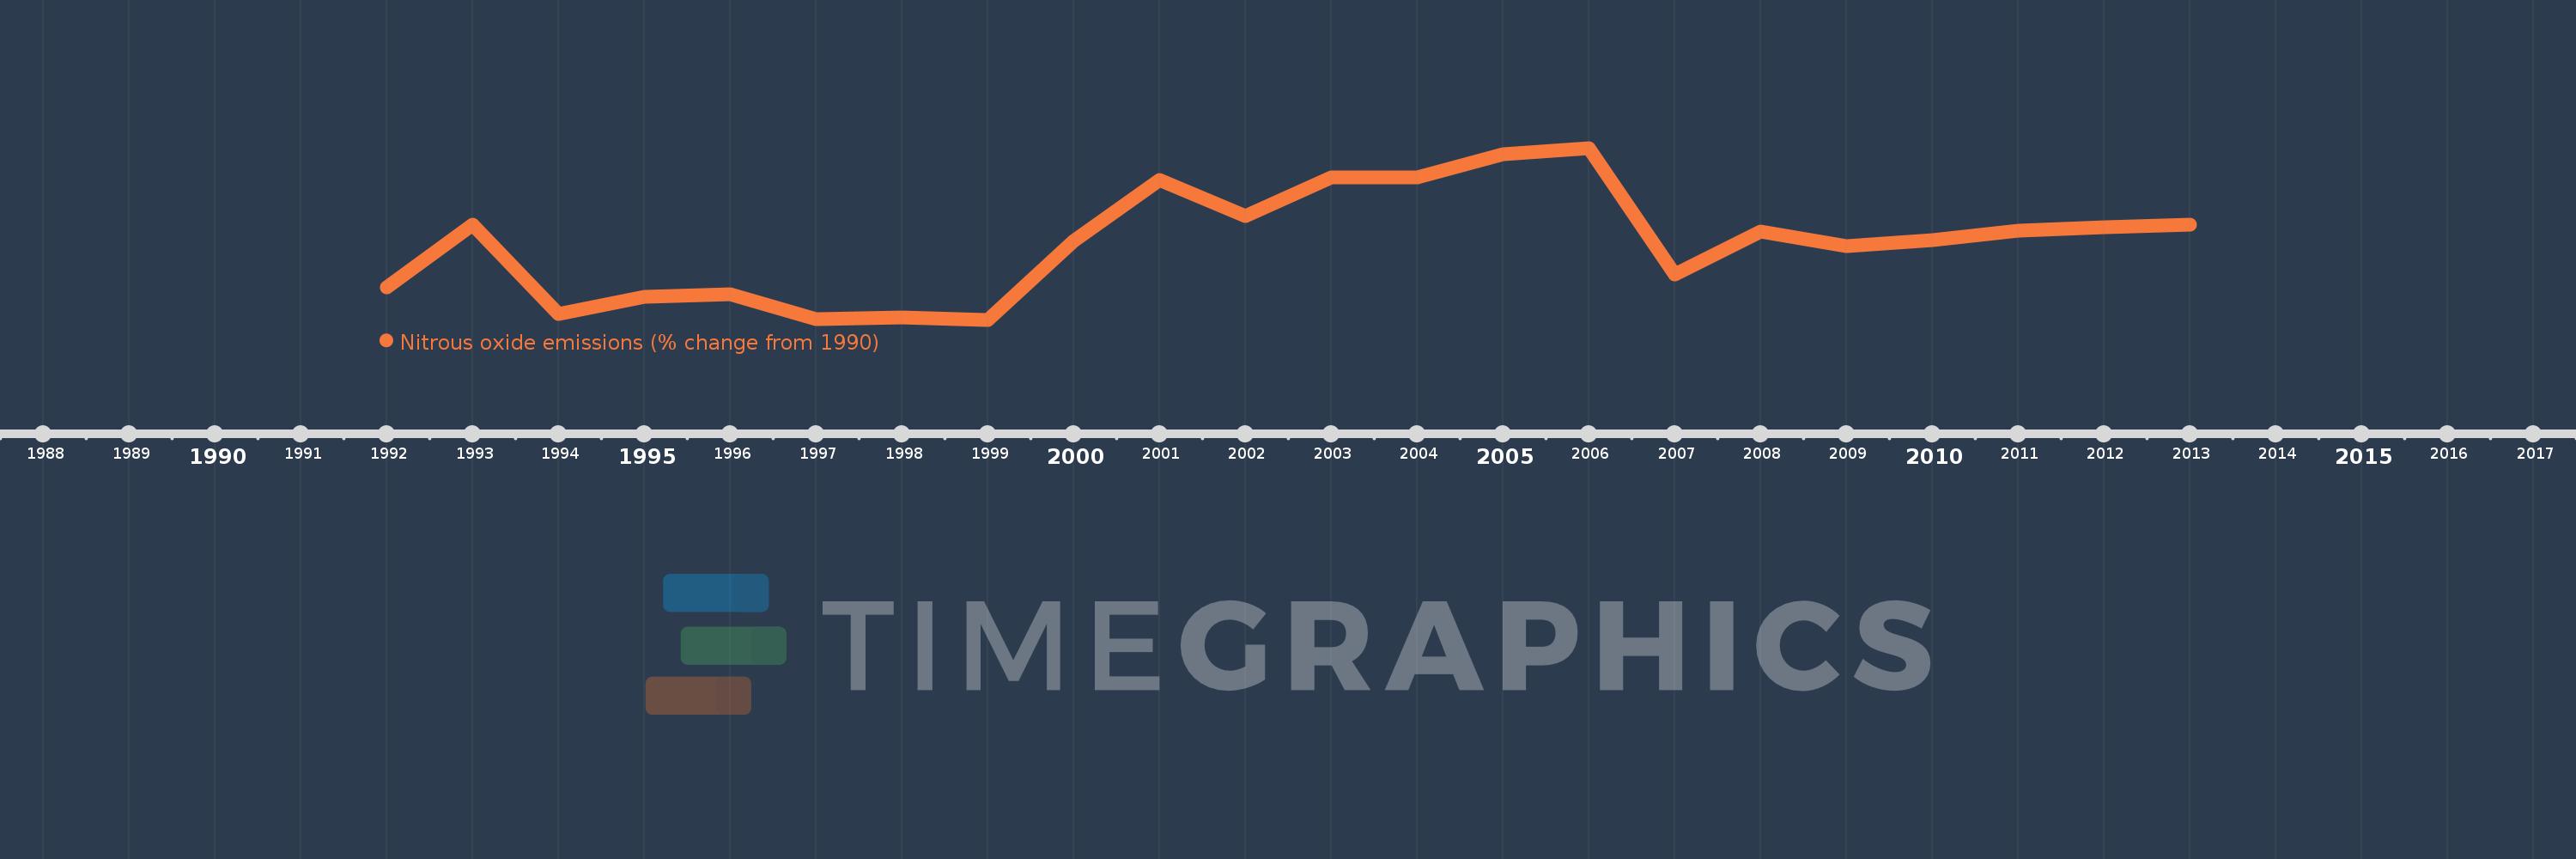
Questa scala temporale mostra un grafico dal 1992 anno al 2013 anno. Namibia. I dati fino ad 1991 anno non disponibili. Il numero di osservazioni attuali secondo i date: 22.
La fonte (nome):
Indicatori dello sviluppo mondiale
La fonte (organizzazione):
World Bank staff estimates from original source: European Commission, Joint Research Centre (JRC)/Netherlands Environmental Assessment Agency (PBL). Emission Database for Global Atmospheric Research (EDGAR): http://edgar.jrc.ec.europa.eu/.
Categorie:
Climate Change, Environment
sono stati aggiornati
23 apr 2017 anni
Indicatori delle variazioni dei valori per anni
In media:
12.094
Minima:
-19.185
1 gen 1999 anni
Massimo:
50.631
1 gen 2006 anni
Alla data di osservazione
Valore
Variazione assoluta
La variazione rispetto al valore precedente
1 gen 1992 anni
-6.024
-6.024
0.0%
1 gen 1993 anni
19.581
+25.605
-425.08%
1 gen 1994 anni
-16.809
-36.39
-185.84%
1 gen 1995 anni
-9.76
+7.049
-41.94%
1 gen 1996 anni
-8.773
+0.987
-10.11%
1 gen 1997 anni
-18.93
-10.157
115.78%
1 gen 1998 anni
-18.25
+0.68
-3.59%
1 gen 1999 anni
-19.185
-0.936
5.13%
1 gen 2000 anni
12.827
+32.012
-166.86%
1 gen 2001 anni
37.559
+24.732
192.81%
1 gen 2002 anni
22.957
-14.602
-38.88%
1 gen 2003 anni
38.624
+15.667
68.24%
1 gen 2004 anni
38.622
-0.001
0.0%
1 gen 2005 anni
47.961
+9.339
24.18%
1 gen 2006 anni
50.631
+2.669
5.57%
1 gen 2007 anni
-0.682
-51.312
-101.35%
1 gen 2008 anni
16.702
+17.384
-2.55 Mille.%
1 gen 2009 anni
10.903
-5.799
-34.72%
1 gen 2010 anni
13.289
+2.386
21.88%
1 gen 2011 anni
17.101
+3.812
28.69%
1 gen 2012 anni
18.272
+1.171
6.85%
1 gen 2013 anni
19.443
+1.171
6.41%
Classificazione dei paesi secondo i statistiche attuali per anni