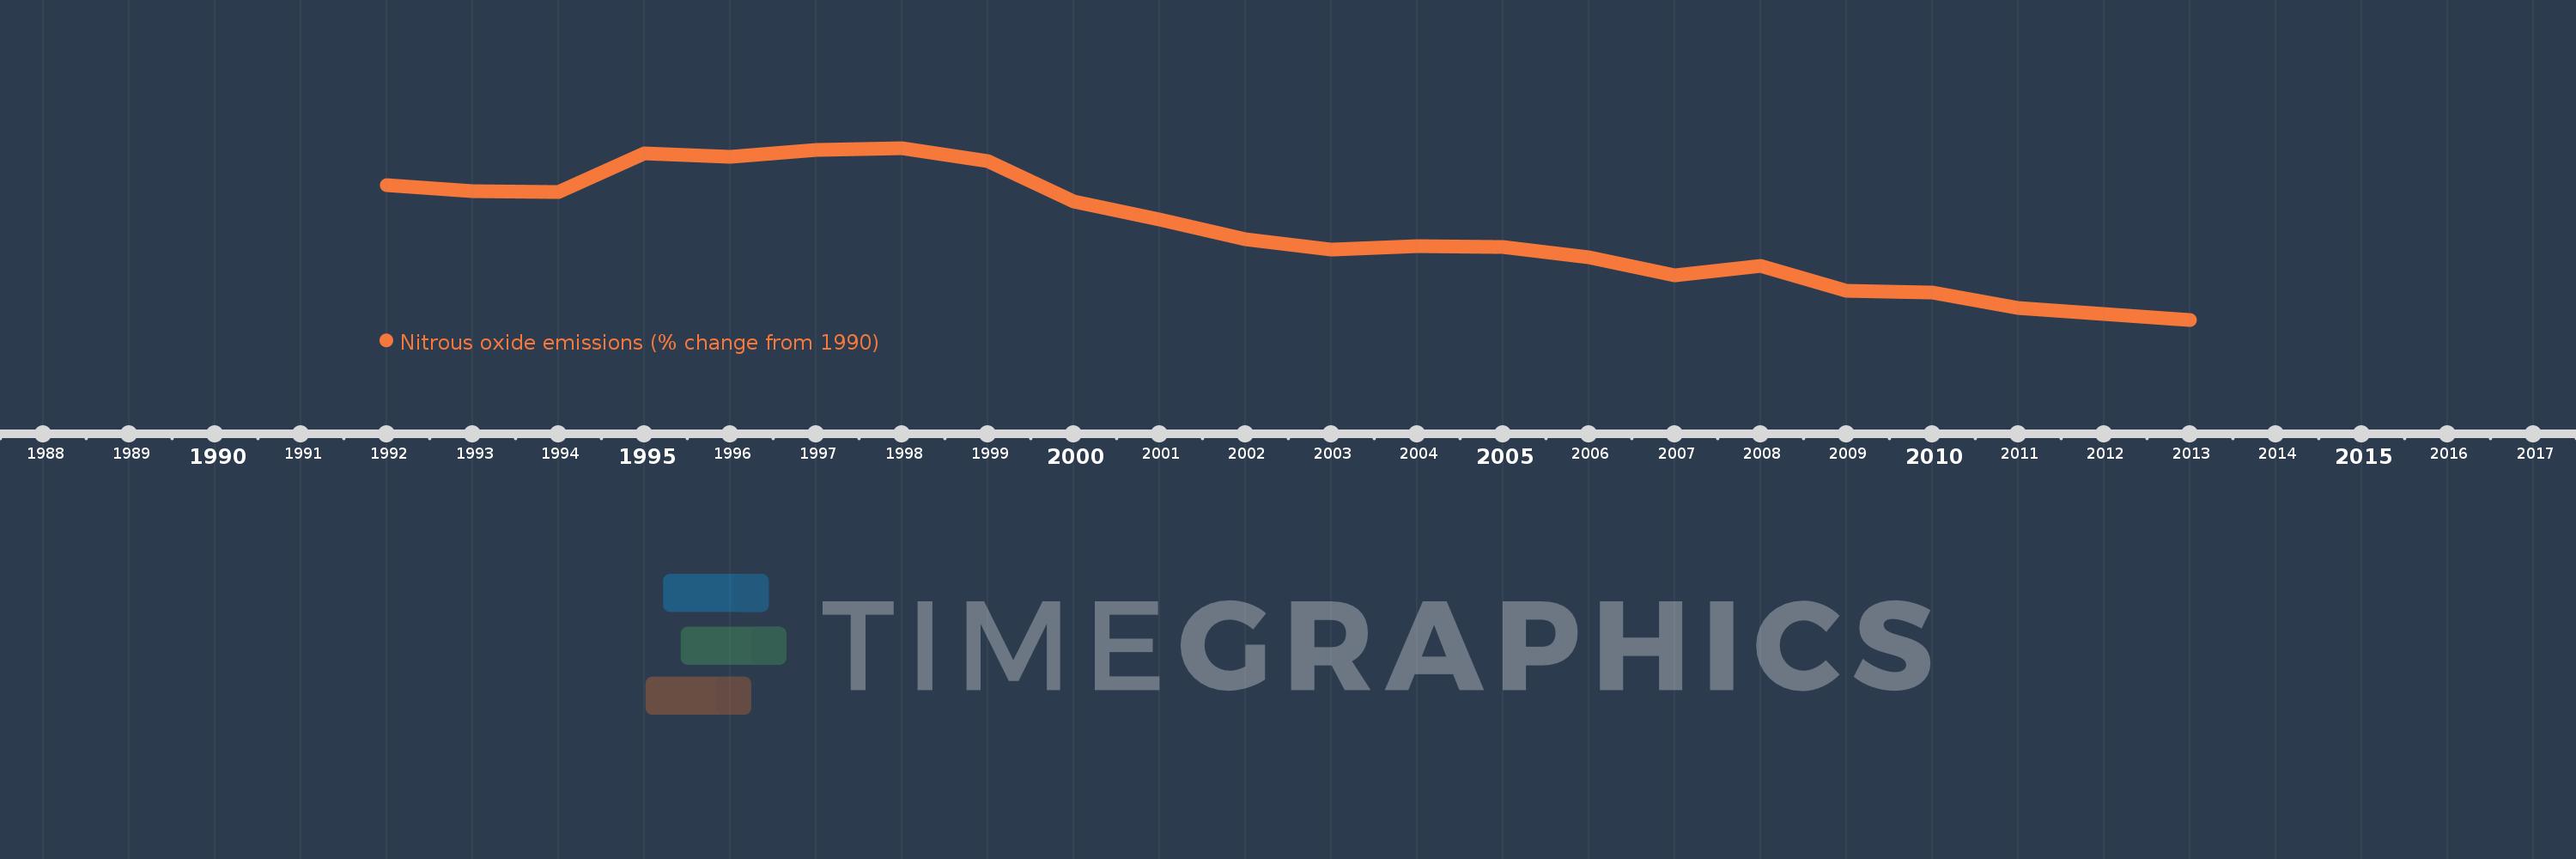
Questa scala temporale mostra un grafico dal 1992 anno al 2013 anno. OECD members. I dati fino ad 1991 anno non disponibili. Il numero di osservazioni attuali secondo i date: 22.
La fonte (nome):
Indicatori dello sviluppo mondiale
La fonte (organizzazione):
World Bank staff estimates from original source: European Commission, Joint Research Centre (JRC)/Netherlands Environmental Assessment Agency (PBL). Emission Database for Global Atmospheric Research (EDGAR): http://edgar.jrc.ec.europa.eu/.
Categorie:
Climate Change, Environment
sono stati aggiornati
23 apr 2017 anni
Indicatori delle variazioni dei valori per anni
In media:
-7.742
Minima:
-21.984
1 gen 2013 anni
Massimo:
5.319
1 gen 1998 anni
Alla data di osservazione
Valore
Variazione assoluta
La variazione rispetto al valore precedente
1 gen 1992 anni
-0.545
-0.545
0.0%
1 gen 1993 anni
-1.548
-1.003
183.85%
1 gen 1994 anni
-1.714
-0.166
10.72%
1 gen 1995 anni
4.393
+6.108
-356.27%
1 gen 1996 anni
3.893
-0.5
-11.38%
1 gen 1997 anni
4.949
+1.055
27.11%
1 gen 1998 anni
5.319
+0.371
7.49%
1 gen 1999 anni
3.24
-2.079
-39.08%
1 gen 2000 anni
-3.157
-6.398
-197.44%
1 gen 2001 anni
-5.994
-2.837
89.84%
1 gen 2002 anni
-9.152
-3.158
52.69%
1 gen 2003 anni
-10.854
-1.701
18.59%
1 gen 2004 anni
-10.283
+0.571
-5.26%
1 gen 2005 anni
-10.394
-0.111
1.08%
1 gen 2006 anni
-12.014
-1.62
15.58%
1 gen 2007 anni
-14.943
-2.929
24.38%
1 gen 2008 anni
-13.411
+1.531
-10.25%
1 gen 2009 anni
-17.317
-3.906
29.12%
1 gen 2010 anni
-17.646
-0.328
1.9%
1 gen 2011 anni
-20.109
-2.463
13.96%
1 gen 2012 anni
-21.063
-0.955
4.75%
1 gen 2013 anni
-21.984
-0.921
4.37%
Classificazione dei paesi secondo i statistiche attuali per anni