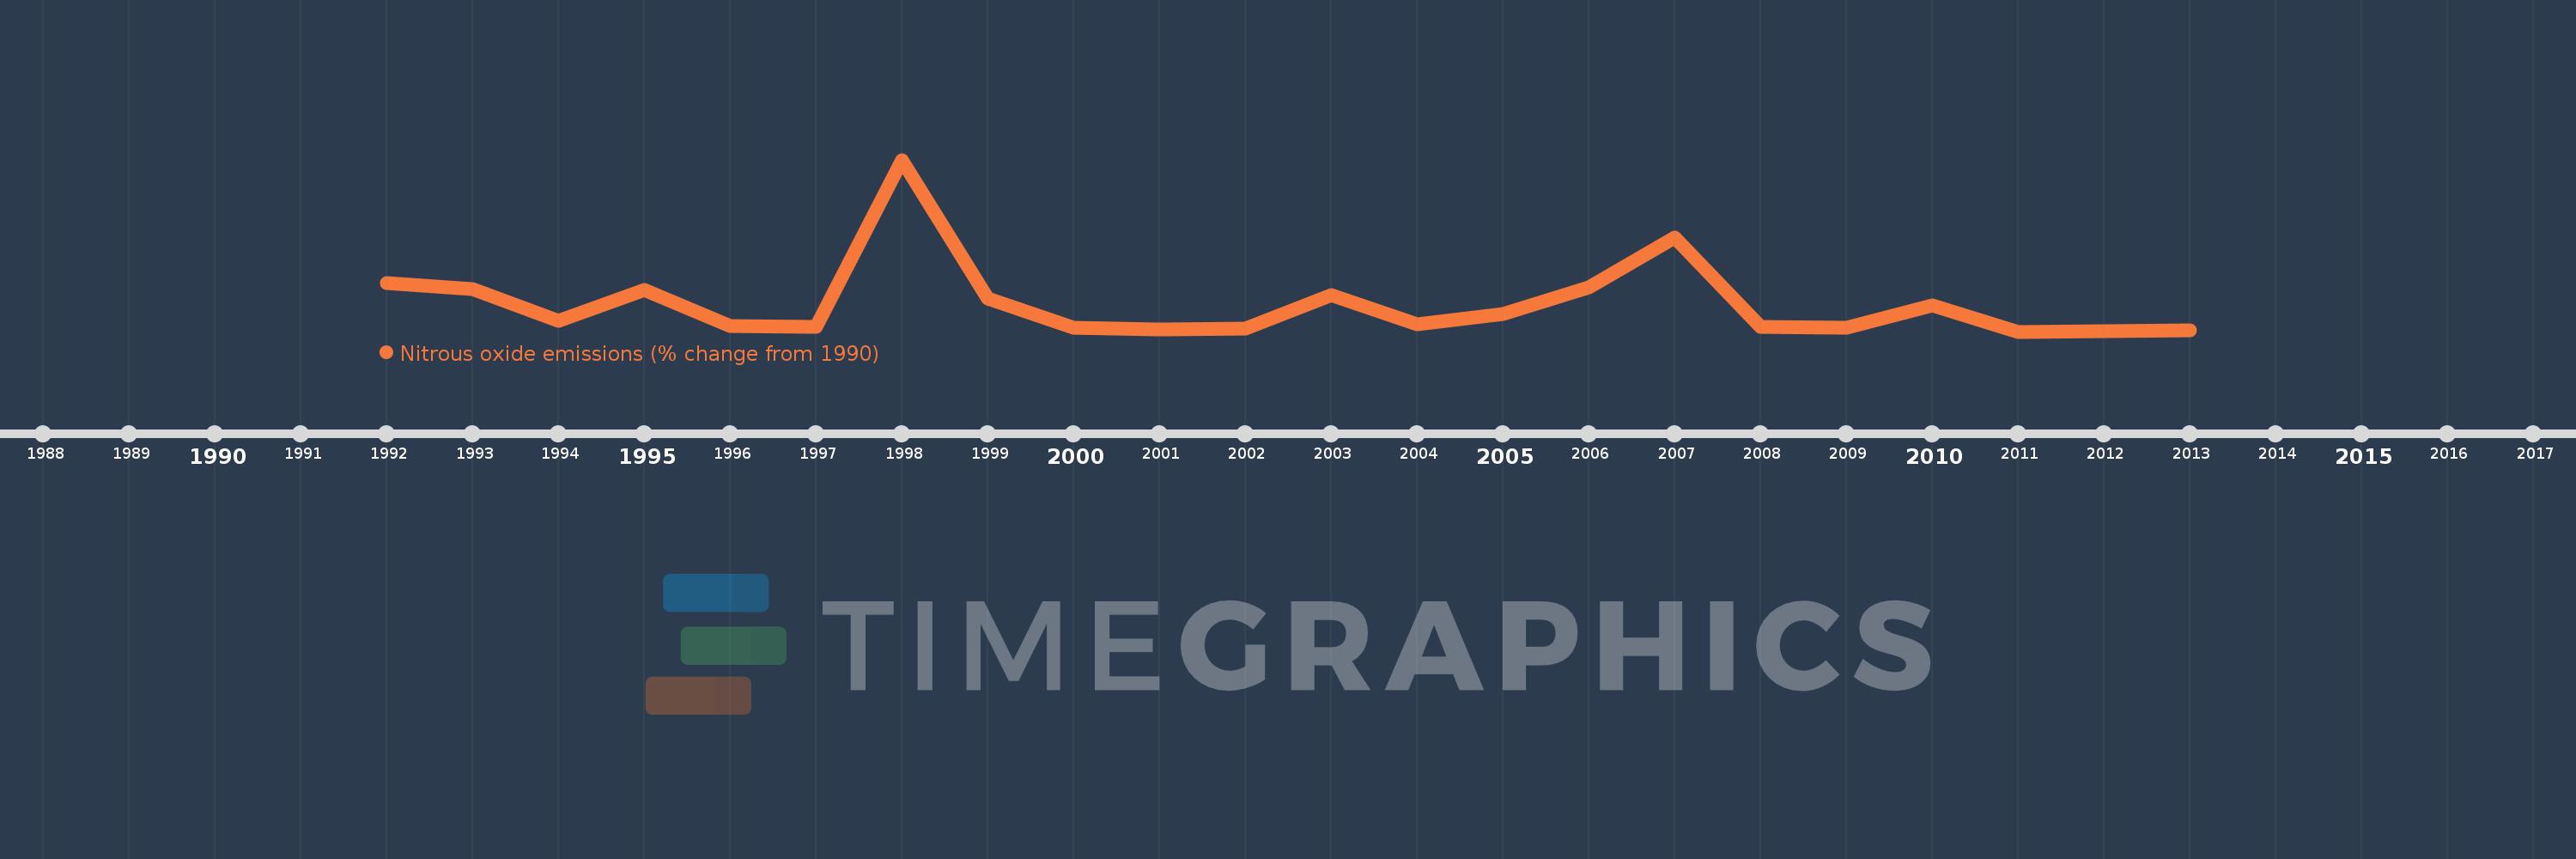
Questa scala temporale mostra un grafico dal 1992 anno al 2013 anno. Indonesia. I dati fino ad 1991 anno non disponibili. Il numero di osservazioni attuali secondo i date: 22.
La fonte (nome):
Indicatori dello sviluppo mondiale
La fonte (organizzazione):
World Bank staff estimates from original source: European Commission, Joint Research Centre (JRC)/Netherlands Environmental Assessment Agency (PBL). Emission Database for Global Atmospheric Research (EDGAR): http://edgar.jrc.ec.europa.eu/.
Categorie:
Climate Change, Environment
sono stati aggiornati
23 apr 2017 anni
Indicatori delle variazioni dei valori per anni
In media:
35.126
Minima:
-9.191
1 gen 2011 anni
Massimo:
267.86
1 gen 1998 anni
Alla data di osservazione
Valore
Variazione assoluta
La variazione rispetto al valore precedente
1 gen 1992 anni
68.897
+68.897
0.0%
1 gen 1993 anni
59.947
-8.95
-12.99%
1 gen 1994 anni
7.987
-51.96
-86.68%
1 gen 1995 anni
58.633
+50.646
634.12%
1 gen 1996 anni
-0.461
-59.093
-100.79%
1 gen 1997 anni
-0.893
-0.432
93.84%
1 gen 1998 anni
267.86
+268.752
-30.1 Mille.%
1 gen 1999 anni
43.458
-224.402
-83.78%
1 gen 2000 anni
-2.439
-45.897
-105.61%
1 gen 2001 anni
-5.591
-3.152
129.25%
1 gen 2002 anni
-3.933
+1.659
-29.66%
1 gen 2003 anni
50.284
+54.216
-1.38 Mille.%
1 gen 2004 anni
2.526
-47.758
-94.98%
1 gen 2005 anni
19.618
+17.092
676.59%
1 gen 2006 anni
61.817
+42.2
215.11%
1 gen 2007 anni
141.856
+80.039
129.48%
1 gen 2008 anni
-2.136
-143.993
-101.51%
1 gen 2009 anni
-3.132
-0.996
46.62%
1 gen 2010 anni
33.32
+36.452
-1.16 Mille.%
1 gen 2011 anni
-9.191
-42.512
-127.58%
1 gen 2012 anni
-8.283
+0.908
-9.88%
1 gen 2013 anni
-7.375
+0.908
-10.96%
Classificazione dei paesi secondo i statistiche attuali per anni