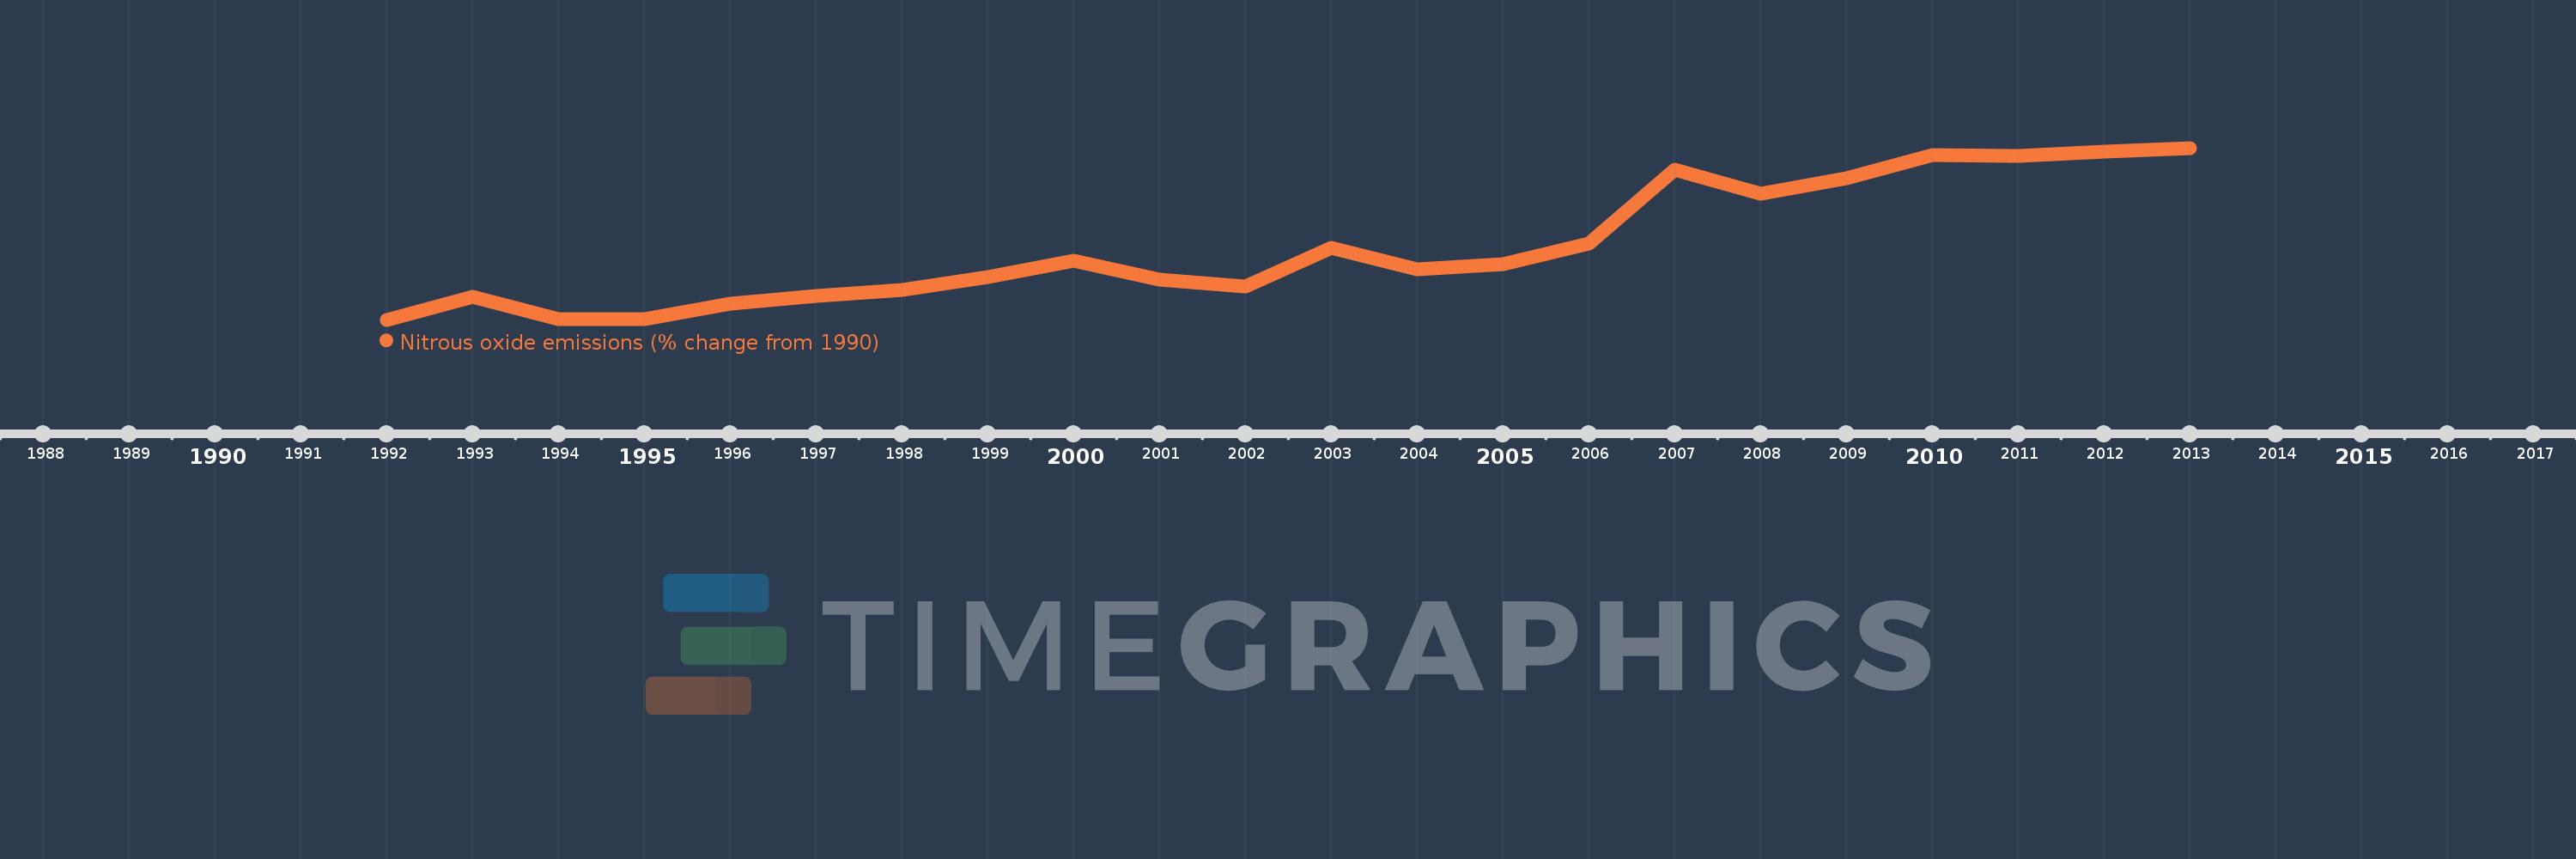
Questa scala temporale mostra un grafico dal 1992 anno al 2013 anno. Ethiopia. I dati fino ad 1991 anno non disponibili. Il numero di osservazioni attuali secondo i date: 22.
La fonte (nome):
Indicatori dello sviluppo mondiale
La fonte (organizzazione):
World Bank staff estimates from original source: European Commission, Joint Research Centre (JRC)/Netherlands Environmental Assessment Agency (PBL). Emission Database for Global Atmospheric Research (EDGAR): http://edgar.jrc.ec.europa.eu/.
Categorie:
Climate Change, Environment
sono stati aggiornati
23 apr 2017 anni
Indicatori delle variazioni dei valori per anni
In media:
18.548
Minima:
-10.461
1 gen 1992 anni
Massimo:
57.657
1 gen 2013 anni
Alla data di osservazione
Valore
Variazione assoluta
La variazione rispetto al valore precedente
1 gen 1992 anni
-10.461
-10.461
0.0%
1 gen 1993 anni
-1.265
+9.196
-87.91%
1 gen 1994 anni
-10.132
-8.867
700.98%
1 gen 1995 anni
-10.366
-0.234
2.31%
1 gen 1996 anni
-4.08
+6.285
-60.64%
1 gen 1997 anni
-1.194
+2.886
-70.74%
1 gen 1998 anni
1.399
+2.593
-217.16%
1 gen 1999 anni
6.527
+5.128
366.51%
1 gen 2000 anni
13.033
+6.506
99.69%
1 gen 2001 anni
5.467
-7.566
-58.05%
1 gen 2002 anni
2.806
-2.661
-48.67%
1 gen 2003 anni
17.981
+15.175
540.83%
1 gen 2004 anni
9.627
-8.354
-46.46%
1 gen 2005 anni
11.511
+1.884
19.57%
1 gen 2006 anni
19.734
+8.223
71.44%
1 gen 2007 anni
48.871
+29.136
147.64%
1 gen 2008 anni
39.591
-9.28
-18.99%
1 gen 2009 anni
45.752
+6.161
15.56%
1 gen 2010 anni
54.926
+9.174
20.05%
1 gen 2011 anni
54.566
-0.361
-0.66%
1 gen 2012 anni
56.111
+1.546
2.83%
1 gen 2013 anni
57.657
+1.546
2.75%
Classificazione dei paesi secondo i statistiche attuali per anni