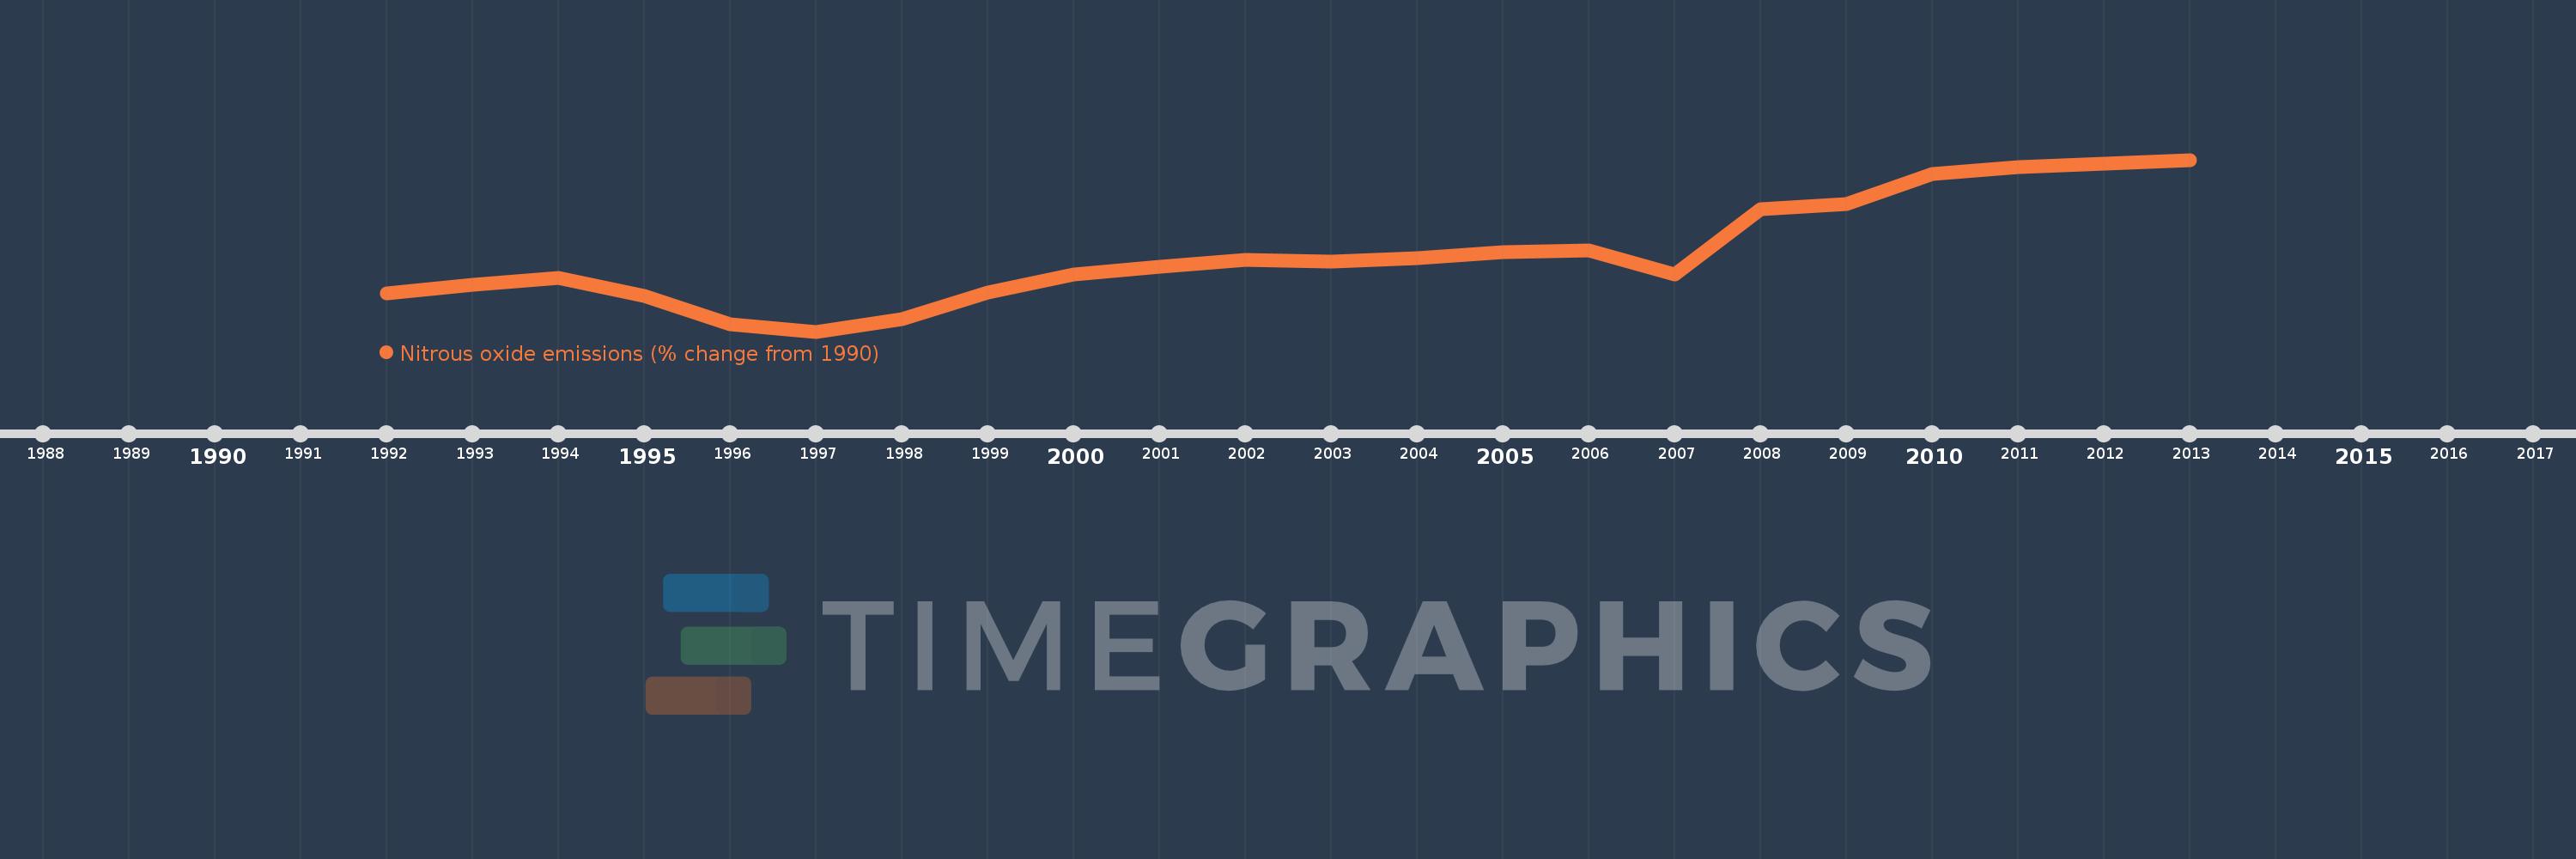
Questa scala temporale mostra un grafico dal 1992 anno al 2013 anno. Algeria. I dati fino ad 1991 anno non disponibili. Il numero di osservazioni attuali secondo i date: 22.
La fonte (nome):
Indicatori dello sviluppo mondiale
La fonte (organizzazione):
World Bank staff estimates from original source: European Commission, Joint Research Centre (JRC)/Netherlands Environmental Assessment Agency (PBL). Emission Database for Global Atmospheric Research (EDGAR): http://edgar.jrc.ec.europa.eu/.
Categorie:
Climate Change, Environment
sono stati aggiornati
23 apr 2017 anni
Indicatori delle variazioni dei valori per anni
In media:
12.902
Minima:
-17.391
1 gen 1997 anni
Massimo:
49.947
1 gen 2013 anni
Alla data di osservazione
Valore
Variazione assoluta
La variazione rispetto al valore precedente
1 gen 1992 anni
-2.404
-2.404
0.0%
1 gen 1993 anni
0.98
+3.384
-140.79%
1 gen 1994 anni
3.695
+2.715
276.89%
1 gen 1995 anni
-3.553
-7.248
-196.16%
1 gen 1996 anni
-14.558
-11.005
309.74%
1 gen 1997 anni
-17.391
-2.833
19.46%
1 gen 1998 anni
-12.377
+5.014
-28.83%
1 gen 1999 anni
-2.141
+10.236
-82.7%
1 gen 2000 anni
5.081
+7.222
-337.28%
1 gen 2001 anni
8.144
+3.063
60.28%
1 gen 2002 anni
10.56
+2.416
29.67%
1 gen 2003 anni
10.002
-0.558
-5.28%
1 gen 2004 anni
11.382
+1.38
13.8%
1 gen 2005 anni
13.818
+2.436
21.41%
1 gen 2006 anni
14.583
+0.765
5.53%
1 gen 2007 anni
5.083
-9.5
-65.14%
1 gen 2008 anni
30.663
+25.58
503.22%
1 gen 2009 anni
32.493
+1.83
5.97%
1 gen 2010 anni
44.36
+11.867
36.52%
1 gen 2011 anni
47.007
+2.648
5.97%
1 gen 2012 anni
48.477
+1.47
3.13%
1 gen 2013 anni
49.947
+1.47
3.03%
Classificazione dei paesi secondo i statistiche attuali per anni