Questa scala temporale mostra un grafico dal 1992 anno al 2013 anno. Argentina. I dati fino ad 1991 anno non disponibili. Il numero di osservazioni attuali secondo i date: 22.
La fonte (nome):
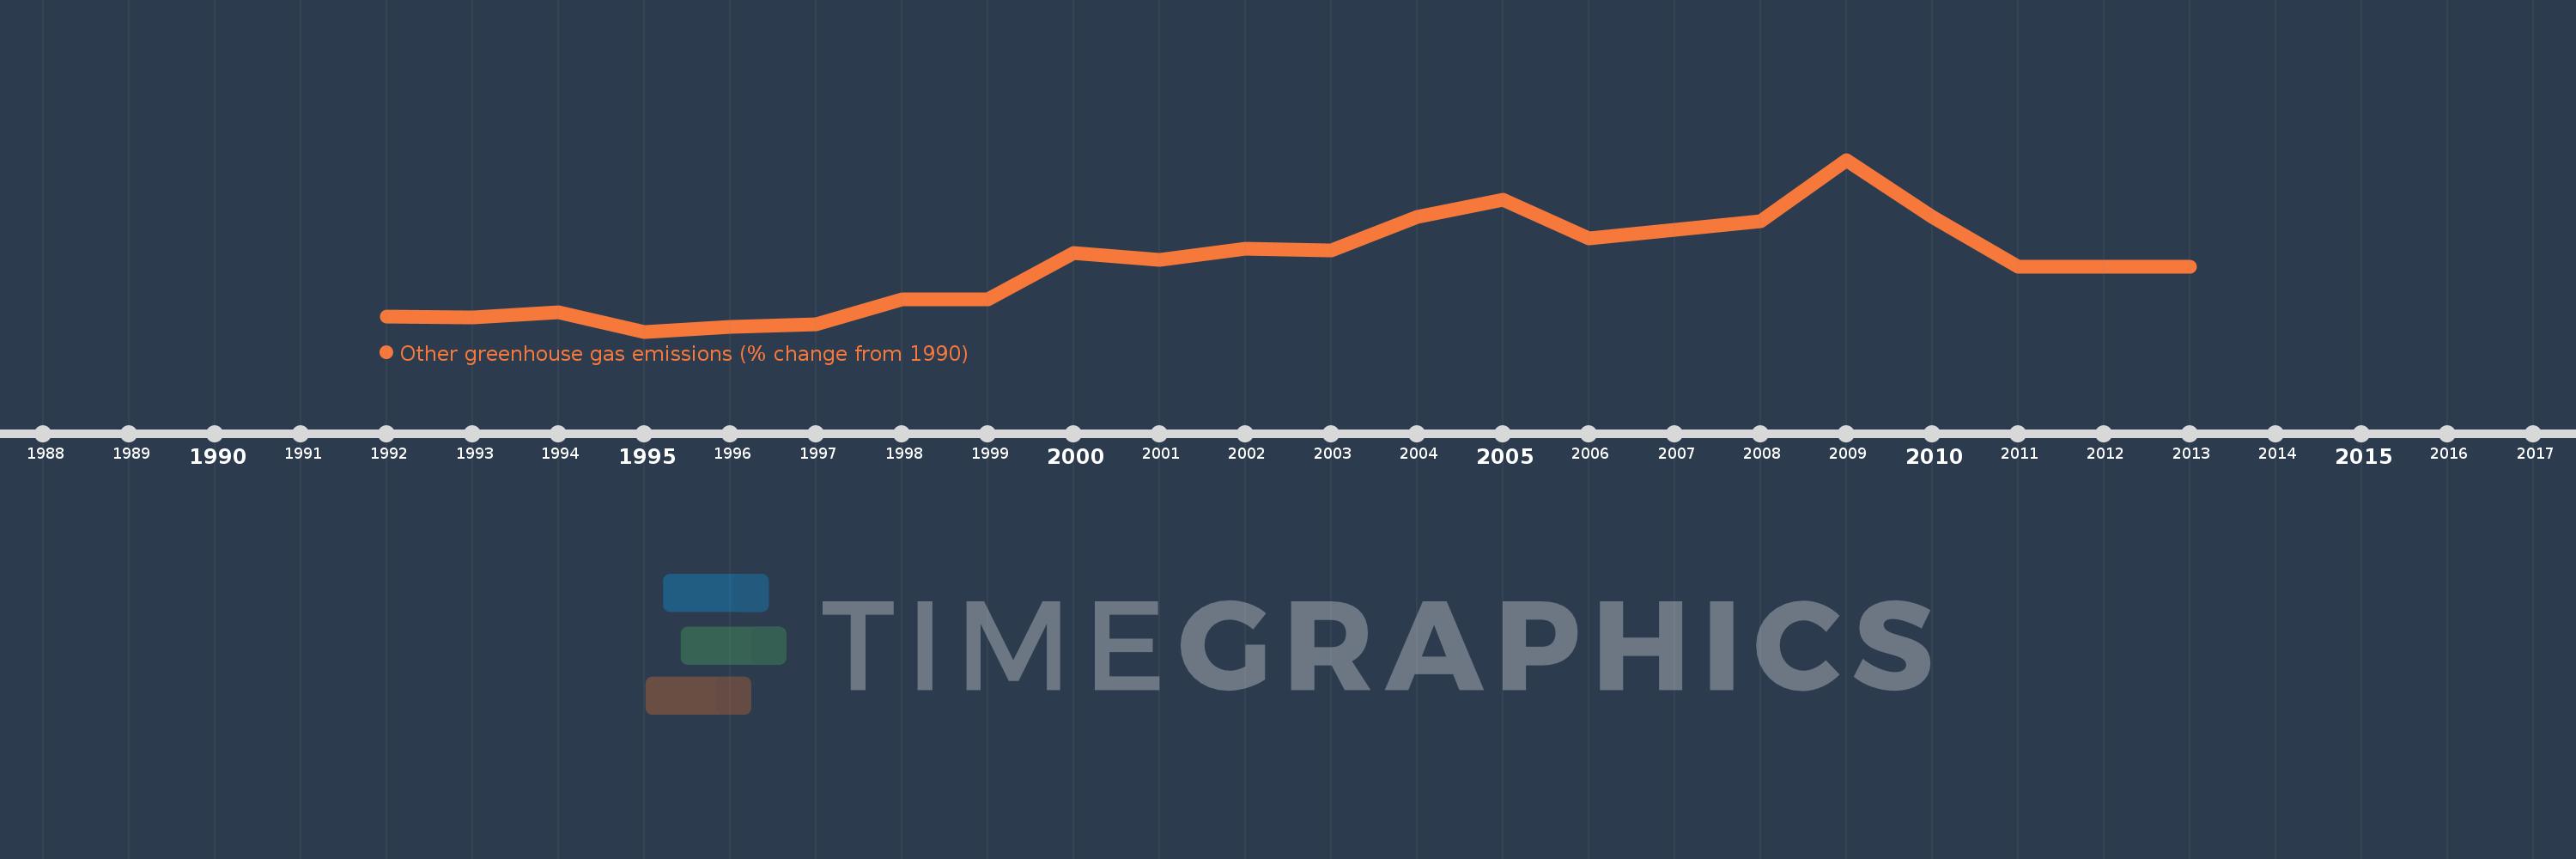
Indicatori dello sviluppo mondiale
La fonte (organizzazione):
World Bank staff estimates from original source: European Commission, Joint Research Centre (JRC)/Netherlands Environmental Assessment Agency (PBL). Emission Database for Global Atmospheric Research (EDGAR): http://edgar.jrc.ec.europa.eu/.
Categorie:
Climate Change, Environment
sono stati aggiornati
23 apr 2017 anni
Indicatori delle variazioni dei valori per anni
In media:
105.093
Minima:
-40.842
1 gen 1995 anni
Massimo:
333.483
1 gen 2009 anni
Alla data di osservazione
Valore
Variazione assoluta
La variazione rispetto al valore precedente
1 gen 1992 anni
-8.14
-8.14
0.0%
1 gen 1993 anni
-9.432
-1.292
15.87%
1 gen 1994 anni
1.539
+10.971
-116.32%
1 gen 1995 anni
-40.842
-42.381
-2.75 Mille.%
1 gen 1996 anni
-29.813
+11.029
-27.0%
1 gen 1997 anni
-24.964
+4.849
-16.27%
1 gen 1998 anni
29.02
+53.983
-216.25%
1 gen 1999 anni
28.818
-0.201
-0.69%
1 gen 2000 anni
130.48
+101.662
352.77%
1 gen 2001 anni
115.944
-14.536
-11.14%
1 gen 2002 anni
139.01
+23.065
19.89%
1 gen 2003 anni
136.645
-2.364
-1.7%
1 gen 2004 anni
209.905
+73.26
53.61%
1 gen 2005 anni
245.922
+36.017
17.16%
1 gen 2006 anni
163.029
-82.893
-33.71%
1 gen 2007 anni
181.119
+18.09
11.1%
1 gen 2008 anni
200.158
+19.04
10.51%
1 gen 2009 anni
333.483
+133.325
66.61%
1 gen 2010 anni
208.804
-124.679
-37.39%
1 gen 2011 anni
100.454
-108.35
-51.89%
1 gen 2012 anni
100.454
0.0
0.0%
1 gen 2013 anni
100.454
0.0
0.0%
Classificazione dei paesi secondo i statistiche attuali per anni