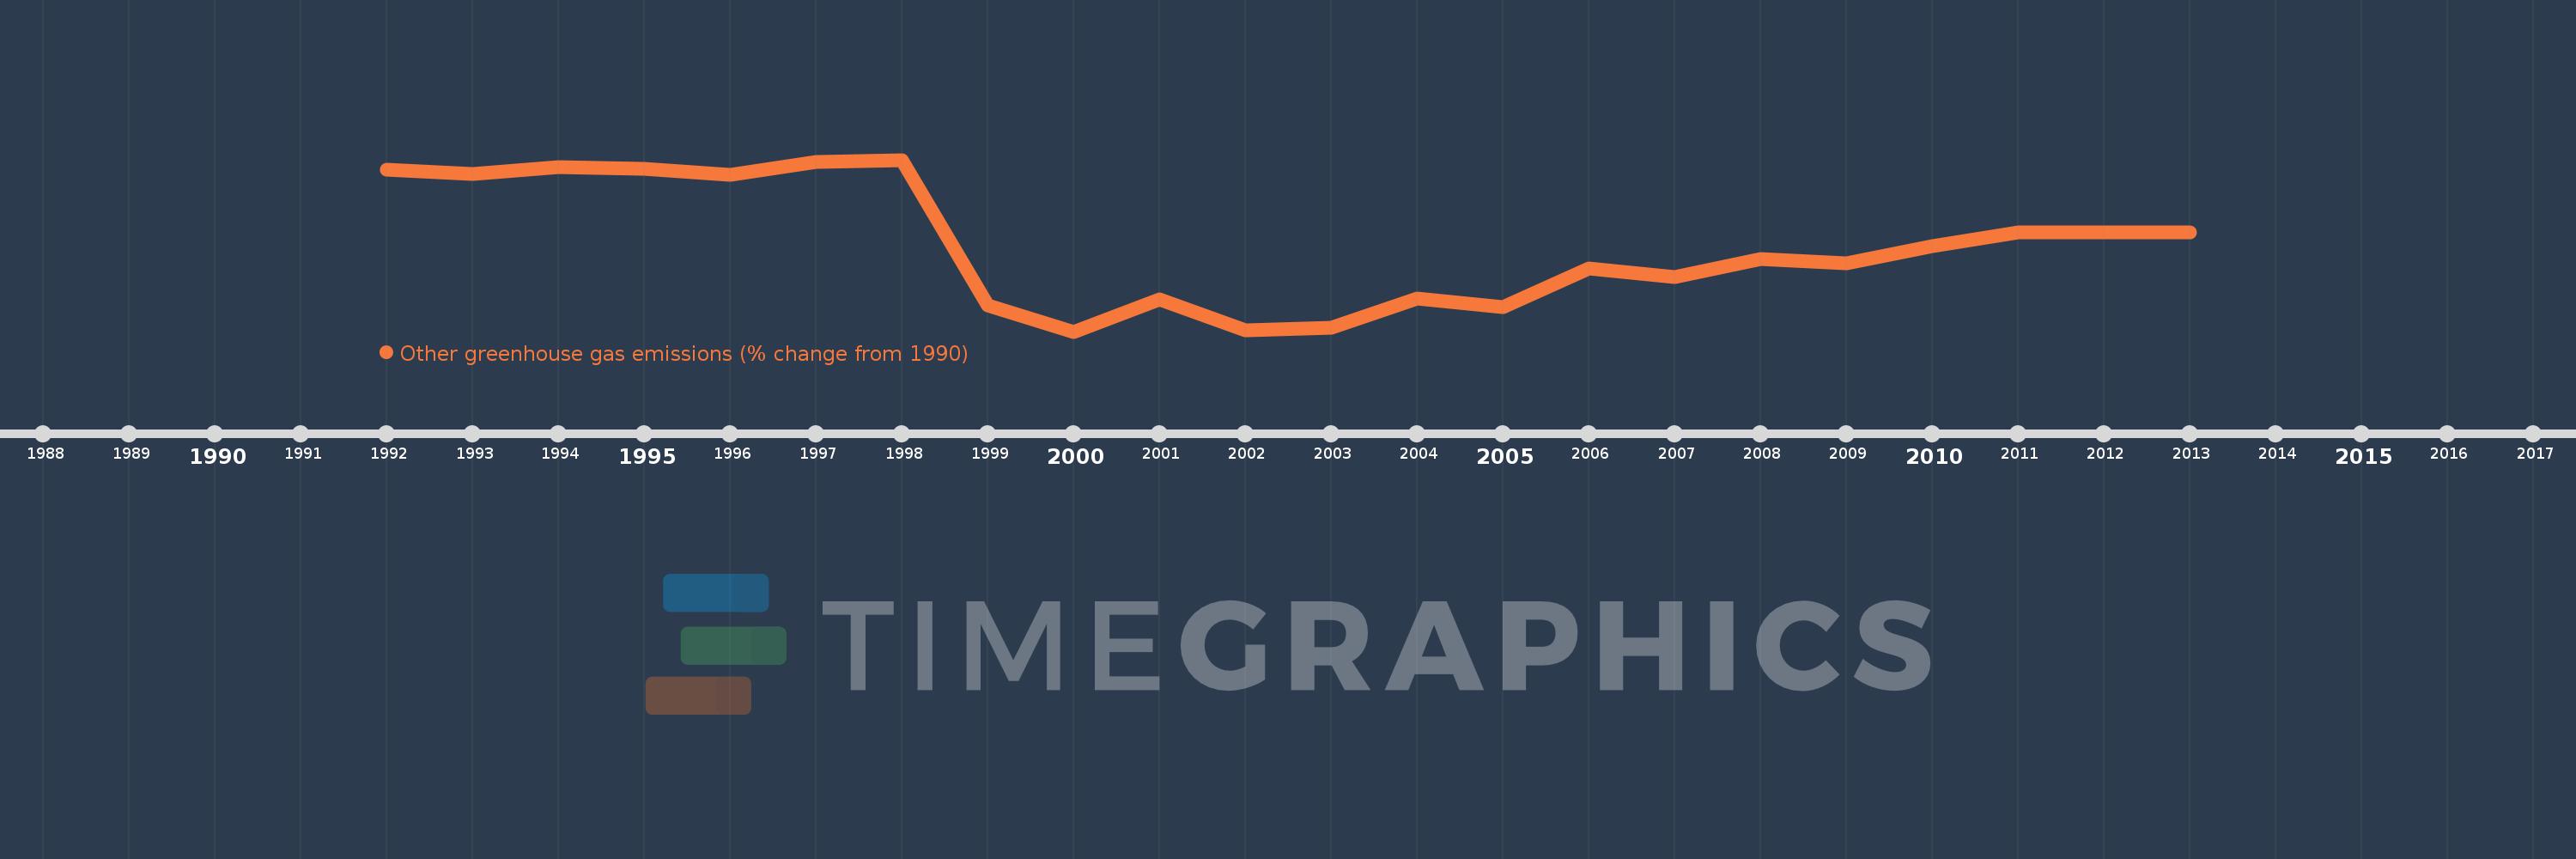
Questa scala temporale mostra un grafico dal 1992 anno al 2013 anno. Euro area. I dati fino ad 1991 anno non disponibili. Il numero di osservazioni attuali secondo i date: 22.
La fonte (nome):
Indicatori dello sviluppo mondiale
La fonte (organizzazione):
World Bank staff estimates from original source: European Commission, Joint Research Centre (JRC)/Netherlands Environmental Assessment Agency (PBL). Emission Database for Global Atmospheric Research (EDGAR): http://edgar.jrc.ec.europa.eu/.
Categorie:
Climate Change, Environment
sono stati aggiornati
23 apr 2017 anni
Indicatori delle variazioni dei valori per anni
In media:
-23.367
Minima:
-50.271
1 gen 2000 anni
Massimo:
3.025
1 gen 1998 anni
Alla data di osservazione
Valore
Variazione assoluta
La variazione rispetto al valore precedente
1 gen 1992 anni
-0.081
-0.081
0.0%
1 gen 1993 anni
-1.278
-1.197
1.48 Mille.%
1 gen 1994 anni
0.721
+2.0
-156.43%
1 gen 1995 anni
0.166
-0.556
-77.03%
1 gen 1996 anni
-1.583
-1.749
-1.06 Mille.%
1 gen 1997 anni
2.353
+3.936
-248.62%
1 gen 1998 anni
3.025
+0.672
28.57%
1 gen 1999 anni
-42.24
-45.266
-1.5 Mille.%
1 gen 2000 anni
-50.271
-8.031
19.01%
1 gen 2001 anni
-40.255
+10.016
-19.92%
1 gen 2002 anni
-49.931
-9.676
24.04%
1 gen 2003 anni
-49.032
+0.898
-1.8%
1 gen 2004 anni
-39.939
+9.093
-18.55%
1 gen 2005 anni
-42.632
-2.693
6.74%
1 gen 2006 anni
-30.81
+11.822
-27.73%
1 gen 2007 anni
-33.25
-2.44
7.92%
1 gen 2008 anni
-27.708
+5.541
-16.67%
1 gen 2009 anni
-28.958
-1.25
4.51%
1 gen 2010 anni
-23.646
+5.313
-18.35%
1 gen 2011 anni
-19.572
+4.073
-17.23%
1 gen 2012 anni
-19.572
0.0
0.0%
1 gen 2013 anni
-19.572
0.0
0.0%
Classificazione dei paesi secondo i statistiche attuali per anni