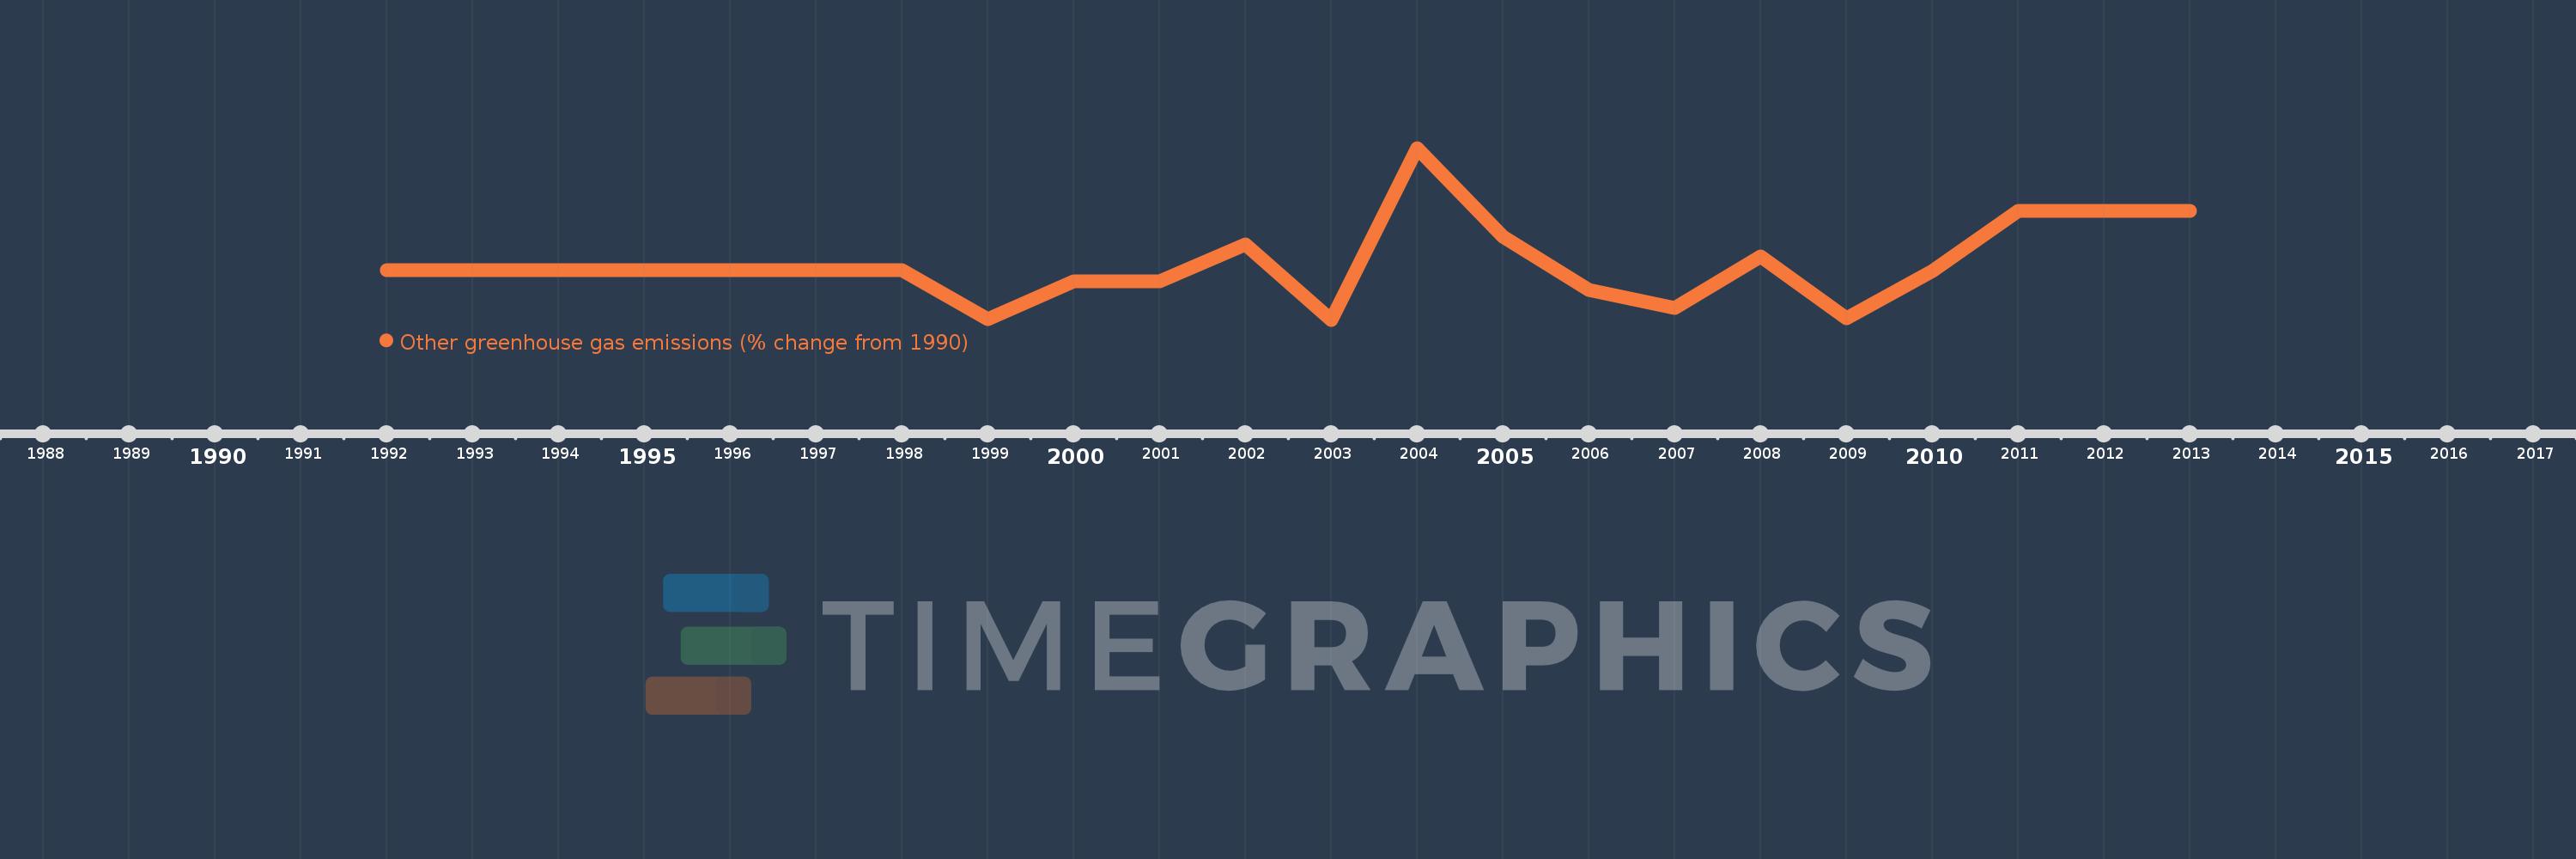
Questa scala temporale mostra un grafico dal 1992 anno al 2013 anno. Afghanistan. I dati fino ad 1991 anno non disponibili. Il numero di osservazioni attuali secondo i date: 22.
La fonte (nome):
Indicatori dello sviluppo mondiale
La fonte (organizzazione):
World Bank staff estimates from original source: European Commission, Joint Research Centre (JRC)/Netherlands Environmental Assessment Agency (PBL). Emission Database for Global Atmospheric Research (EDGAR): http://edgar.jrc.ec.europa.eu/.
Categorie:
Climate Change, Environment
sono stati aggiornati
23 apr 2017 anni
Indicatori delle variazioni dei valori per anni
In media:
13.585
Minima:
-97.979
1 gen 2003 anni
Massimo:
243.502
1 gen 2004 anni
Alla data di osservazione
Valore
Variazione assoluta
La variazione rispetto al valore precedente
1 gen 1992 anni
0.0
0.0
0.0%
1 gen 1993 anni
0.0
+0.0
%
1 gen 1994 anni
0.0
0.0
-200.0%
1 gen 1995 anni
0.0
+0.0
-100.0%
1 gen 1996 anni
0.0
0.0
%
1 gen 1997 anni
0.0
0.0
%
1 gen 1998 anni
0.0
0.0
%
1 gen 1999 anni
-96.25
-96.25
15481.12 Trln%
1 gen 2000 anni
-21.95
+74.3
-77.19%
1 gen 2001 anni
-20.956
+0.994
-4.53%
1 gen 2002 anni
52.198
+73.154
-349.08%
1 gen 2003 anni
-97.979
-150.177
-287.71%
1 gen 2004 anni
243.502
+341.481
-348.53%
1 gen 2005 anni
67.051
-176.451
-72.46%
1 gen 2006 anni
-38.396
-105.447
-157.26%
1 gen 2007 anni
-74.998
-36.602
95.33%
1 gen 2008 anni
27.851
+102.85
-137.14%
1 gen 2009 anni
-94.363
-122.214
-438.81%
1 gen 2010 anni
-1.208
+93.155
-98.72%
1 gen 2011 anni
118.125
+119.333
-9.88 Mille.%
1 gen 2012 anni
118.125
0.0
0.0%
1 gen 2013 anni
118.125
+0.0
0.0%
Classificazione dei paesi secondo i statistiche attuali per anni