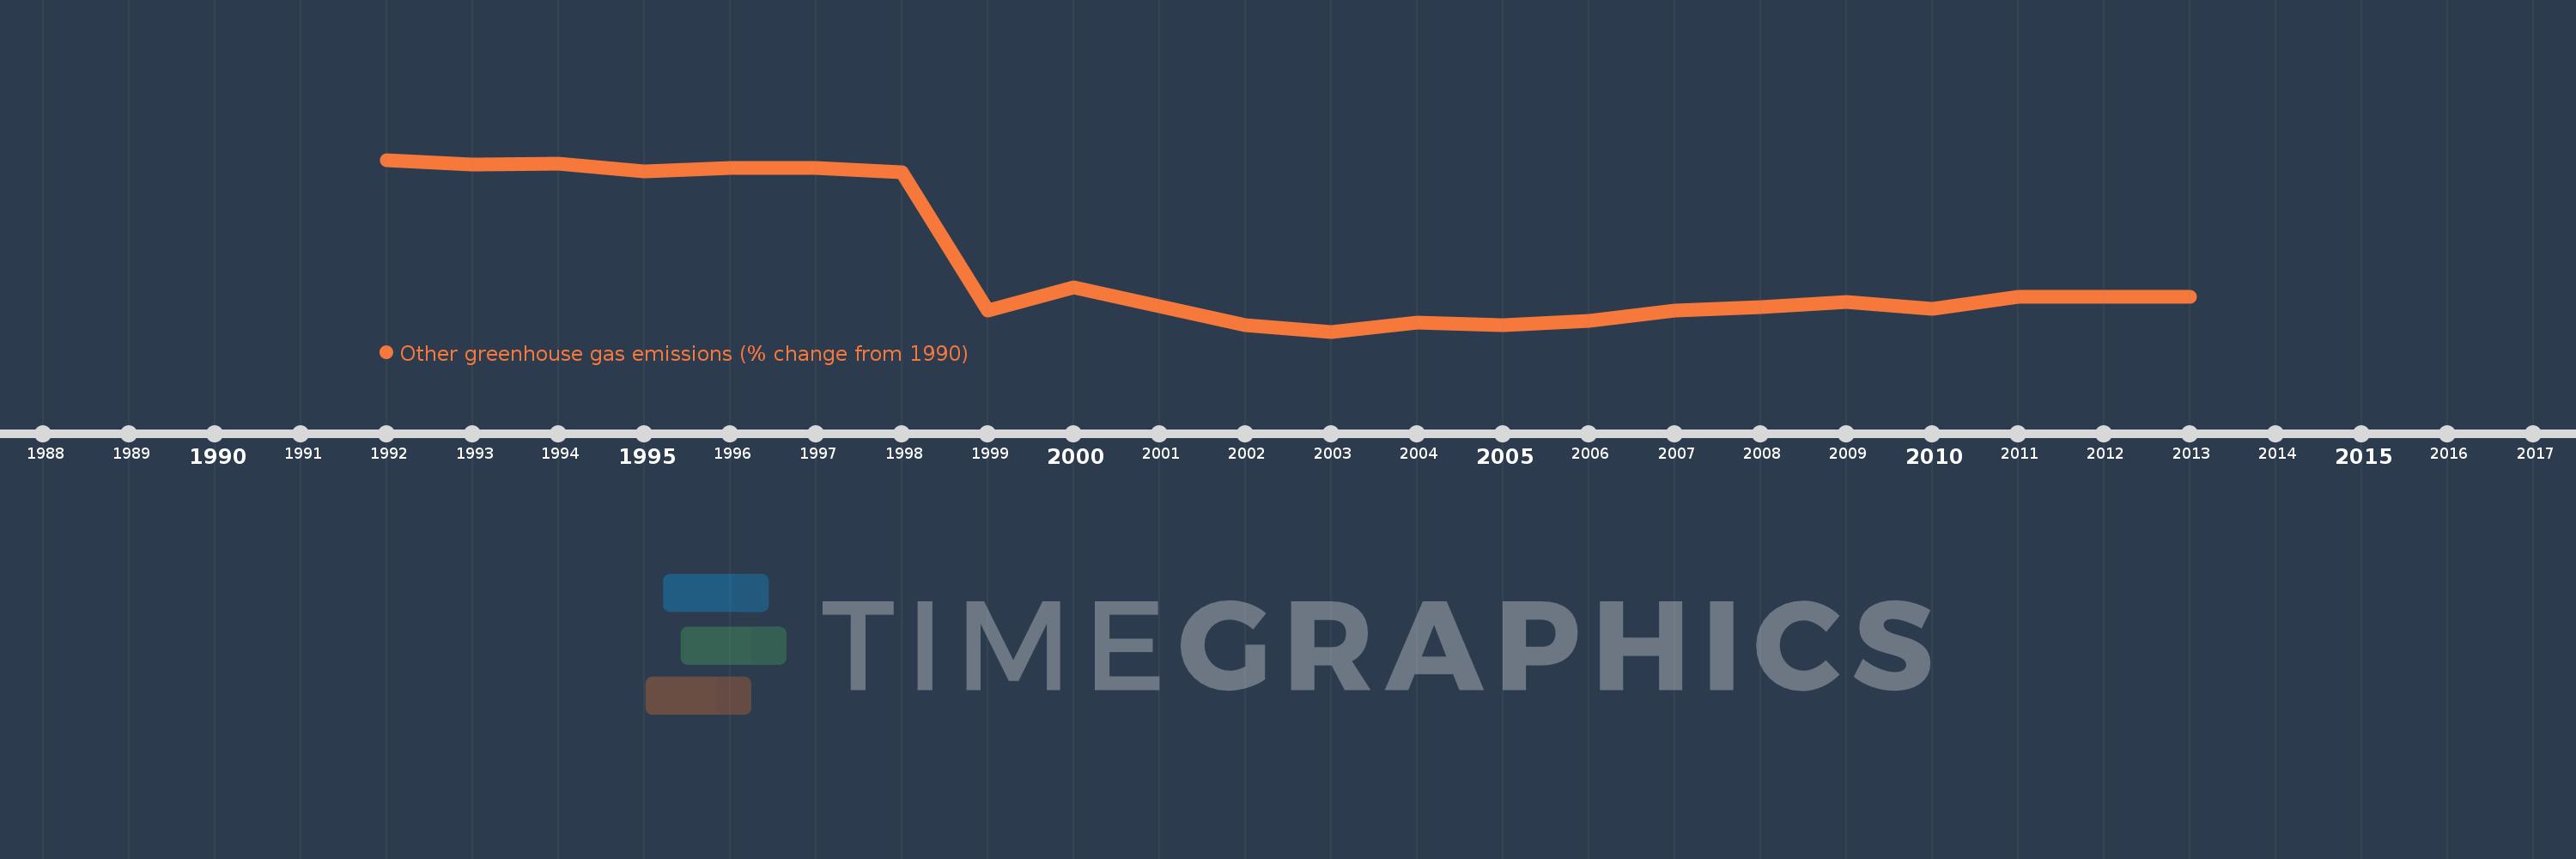
Questa scala temporale mostra un grafico dal 1992 anno al 2013 anno. New Zealand. I dati fino ad 1991 anno non disponibili. Il numero di osservazioni attuali secondo i date: 22.
La fonte (nome):
Indicatori dello sviluppo mondiale
La fonte (organizzazione):
World Bank staff estimates from original source: European Commission, Joint Research Centre (JRC)/Netherlands Environmental Assessment Agency (PBL). Emission Database for Global Atmospheric Research (EDGAR): http://edgar.jrc.ec.europa.eu/.
Categorie:
Climate Change, Environment
sono stati aggiornati
23 apr 2017 anni
Indicatori delle variazioni dei valori per anni
In media:
-52.673
Minima:
-85.579
1 gen 2003 anni
Massimo:
-1.48
1 gen 1992 anni
Alla data di osservazione
Valore
Variazione assoluta
La variazione rispetto al valore precedente
1 gen 1992 anni
-1.48
-1.48
0.0%
1 gen 1993 anni
-3.642
-2.162
146.07%
1 gen 1994 anni
-3.226
+0.417
-11.44%
1 gen 1995 anni
-7.355
-4.129
128.01%
1 gen 1996 anni
-5.627
+1.728
-23.5%
1 gen 1997 anni
-5.643
-0.017
0.29%
1 gen 1998 anni
-7.614
-1.97
34.92%
1 gen 1999 anni
-75.247
-67.634
888.31%
1 gen 2000 anni
-63.887
+11.361
-15.1%
1 gen 2001 anni
-73.157
-9.27
14.51%
1 gen 2002 anni
-82.366
-9.21
12.59%
1 gen 2003 anni
-85.579
-3.213
3.9%
1 gen 2004 anni
-81.358
+4.22
-4.93%
1 gen 2005 anni
-82.579
-1.22
1.5%
1 gen 2006 anni
-80.218
+2.36
-2.86%
1 gen 2007 anni
-75.238
+4.98
-6.21%
1 gen 2008 anni
-73.388
+1.851
-2.46%
1 gen 2009 anni
-70.981
+2.406
-3.28%
1 gen 2010 anni
-74.573
-3.592
5.06%
1 gen 2011 anni
-68.549
+6.024
-8.08%
1 gen 2012 anni
-68.549
0.0
0.0%
1 gen 2013 anni
-68.549
+0.0
0.0%
Classificazione dei paesi secondo i statistiche attuali per anni