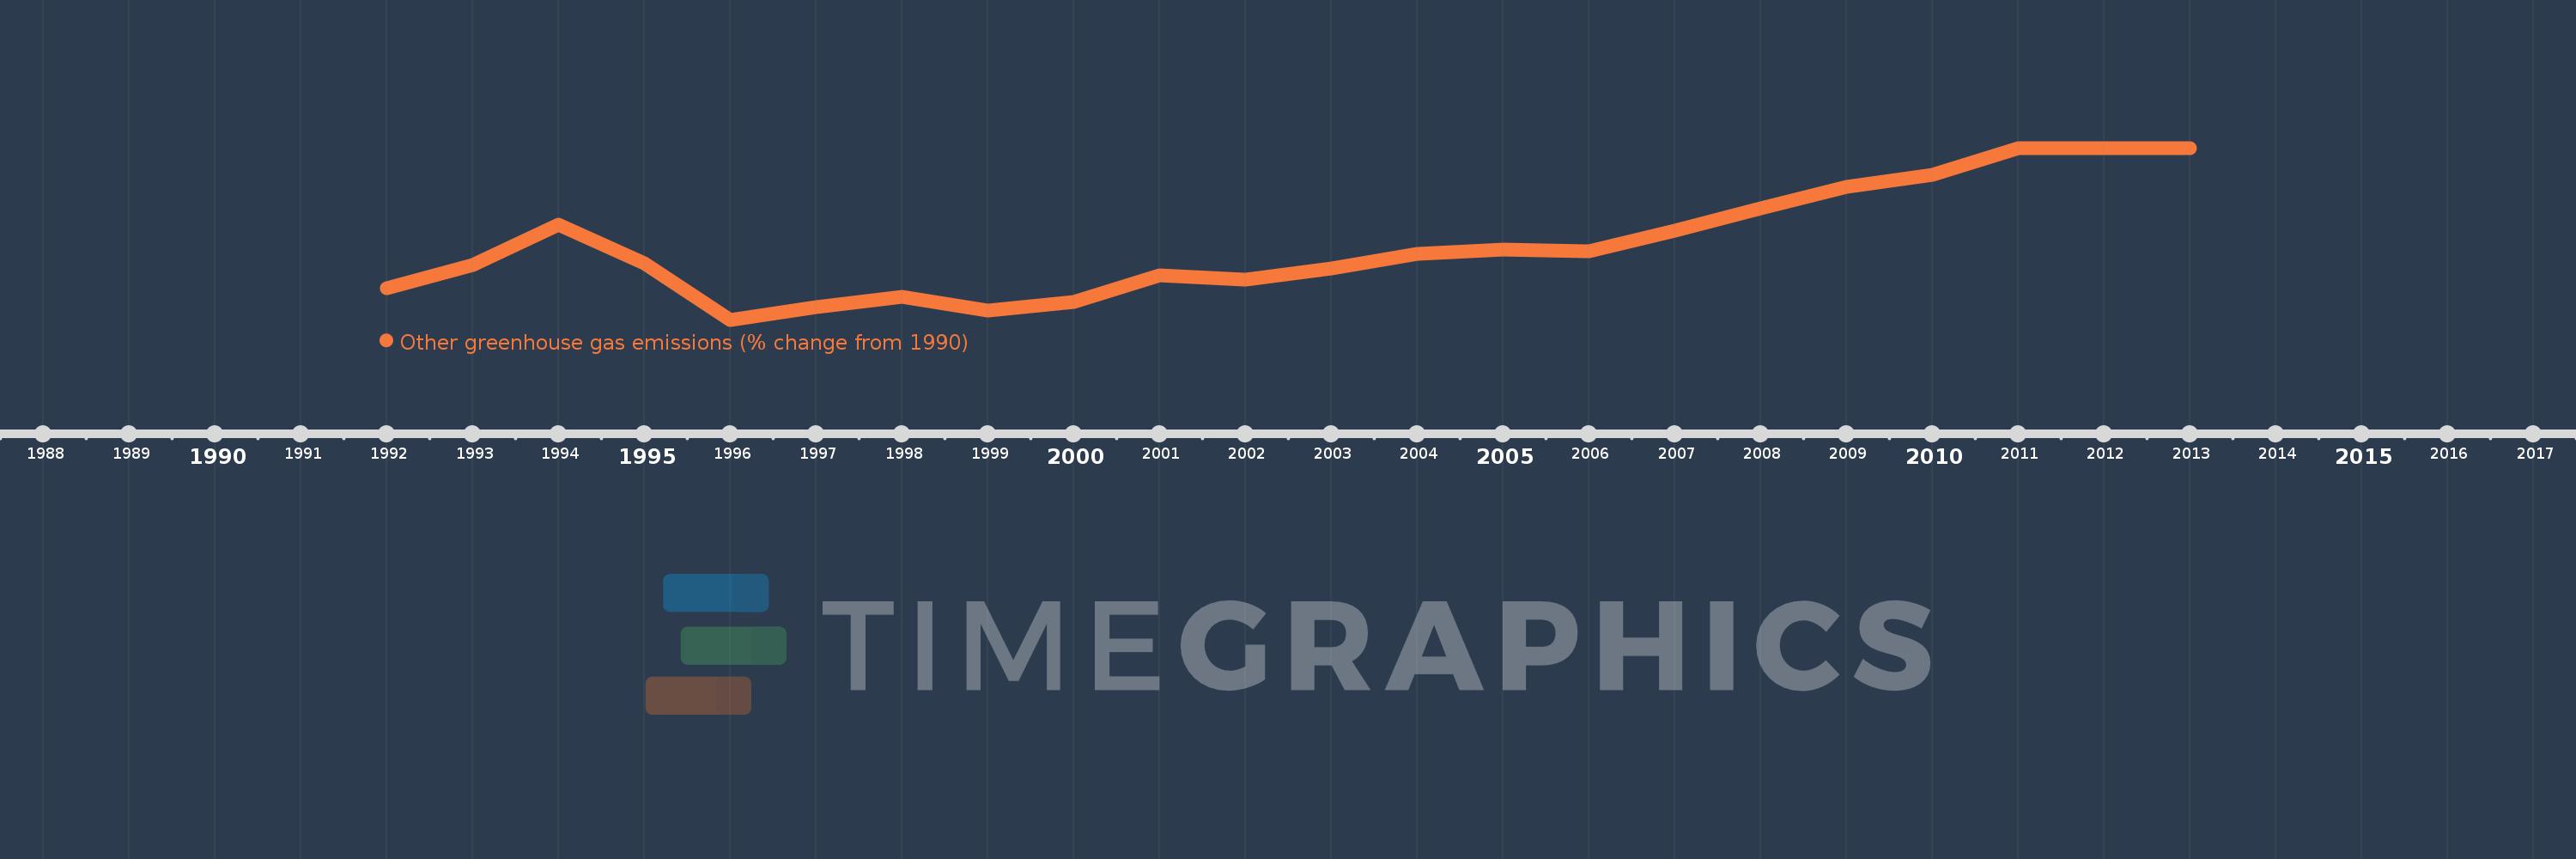
Questa scala temporale mostra un grafico dal 1992 anno al 2013 anno. France. I dati fino ad 1991 anno non disponibili. Il numero di osservazioni attuali secondo i date: 22.
La fonte (nome):
Indicatori dello sviluppo mondiale
La fonte (organizzazione):
World Bank staff estimates from original source: European Commission, Joint Research Centre (JRC)/Netherlands Environmental Assessment Agency (PBL). Emission Database for Global Atmospheric Research (EDGAR): http://edgar.jrc.ec.europa.eu/.
Categorie:
Climate Change, Environment
sono stati aggiornati
23 apr 2017 anni
Indicatori delle variazioni dei valori per anni
In media:
27.086
Minima:
-11.974
1 gen 1996 anni
Massimo:
78.364
1 gen 2011 anni
Alla data di osservazione
Valore
Variazione assoluta
La variazione rispetto al valore precedente
1 gen 1992 anni
4.66
+4.66
0.0%
1 gen 1993 anni
16.994
+12.335
264.71%
1 gen 1994 anni
37.821
+20.826
122.55%
1 gen 1995 anni
17.741
-20.08
-53.09%
1 gen 1996 anni
-11.974
-29.715
-167.5%
1 gen 1997 anni
-5.436
+6.538
-54.6%
1 gen 1998 anni
0.203
+5.639
-103.73%
1 gen 1999 anni
-7.235
-7.438
-3.67 Mille.%
1 gen 2000 anni
-2.494
+4.742
-65.54%
1 gen 2001 anni
11.308
+13.802
-553.51%
1 gen 2002 anni
9.159
-2.15
-19.01%
1 gen 2003 anni
14.92
+5.761
62.91%
1 gen 2004 anni
22.887
+7.967
53.4%
1 gen 2005 anni
24.731
+1.844
8.06%
1 gen 2006 anni
23.851
-0.88
-3.56%
1 gen 2007 anni
34.875
+11.024
46.22%
1 gen 2008 anni
46.426
+11.551
33.12%
1 gen 2009 anni
58.113
+11.687
25.17%
1 gen 2010 anni
64.262
+6.149
10.58%
1 gen 2011 anni
78.364
+14.102
21.94%
1 gen 2012 anni
78.364
0.0
0.0%
1 gen 2013 anni
78.364
0.0
0.0%
Classificazione dei paesi secondo i statistiche attuali per anni