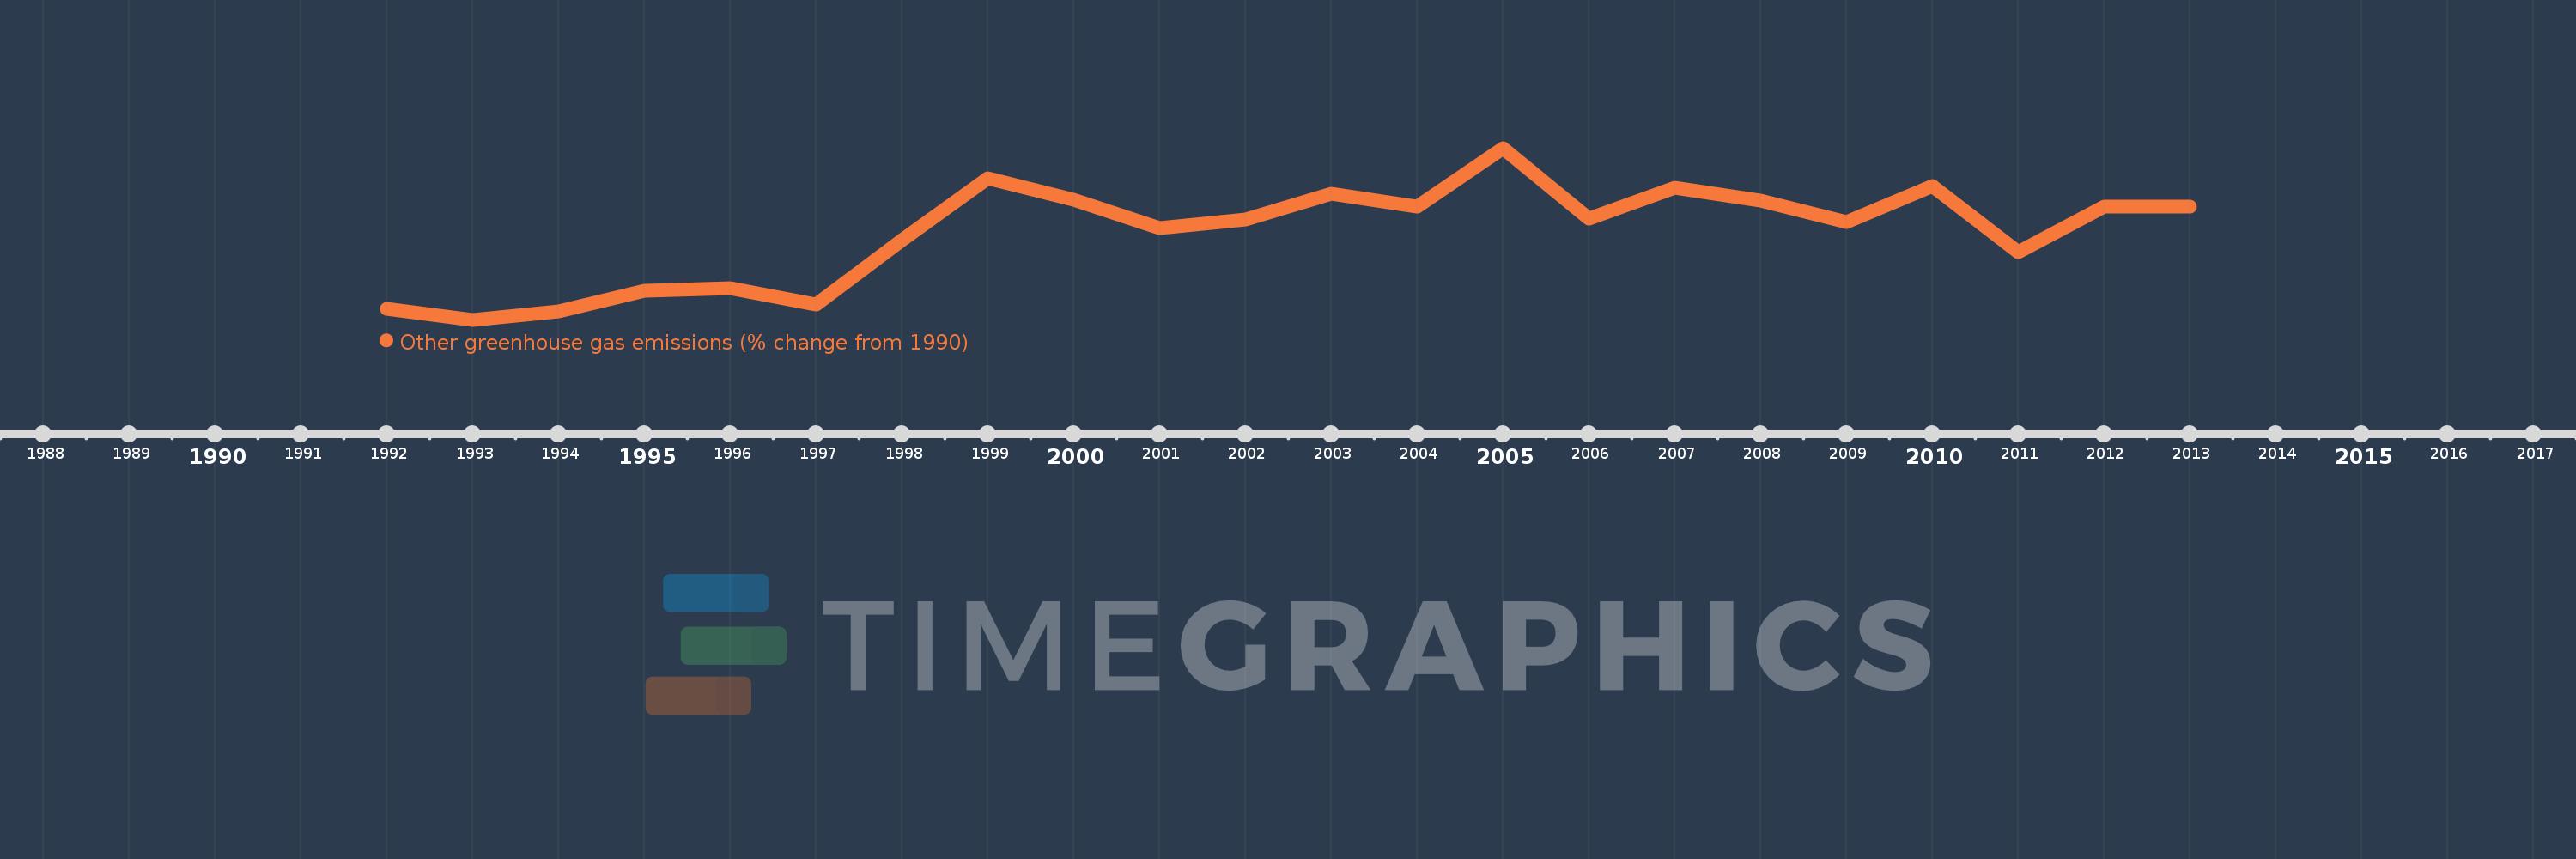
Questa scala temporale mostra un grafico dal 1992 anno al 2013 anno. OECD members. I dati fino ad 1991 anno non disponibili. Il numero di osservazioni attuali secondo i date: 22.
La fonte (nome):
Indicatori dello sviluppo mondiale
La fonte (organizzazione):
World Bank staff estimates from original source: European Commission, Joint Research Centre (JRC)/Netherlands Environmental Assessment Agency (PBL). Emission Database for Global Atmospheric Research (EDGAR): http://edgar.jrc.ec.europa.eu/.
Categorie:
Climate Change, Environment
sono stati aggiornati
23 apr 2017 anni
Indicatori delle variazioni dei valori per anni
In media:
87.538
Minima:
-7.634
1 gen 1993 anni
Massimo:
180.011
1 gen 2005 anni
Alla data di osservazione
Valore
Variazione assoluta
La variazione rispetto al valore precedente
1 gen 1992 anni
4.121
+4.121
0.0%
1 gen 1993 anni
-7.634
-11.755
-285.25%
1 gen 1994 anni
1.539
+9.173
-120.16%
1 gen 1995 anni
24.085
+22.546
1.47 Mille.%
1 gen 1996 anni
26.708
+2.622
10.89%
1 gen 1997 anni
8.833
-17.875
-66.93%
1 gen 1998 anni
79.179
+70.346
796.42%
1 gen 1999 anni
146.834
+67.655
85.45%
1 gen 2000 anni
123.663
-23.17
-15.78%
1 gen 2001 anni
92.448
-31.215
-25.24%
1 gen 2002 anni
101.762
+9.313
10.07%
1 gen 2003 anni
130.131
+28.37
27.88%
1 gen 2004 anni
115.81
-14.322
-11.01%
1 gen 2005 anni
180.011
+64.201
55.44%
1 gen 2006 anni
102.662
-77.349
-42.97%
1 gen 2007 anni
136.476
+33.814
32.94%
1 gen 2008 anni
122.957
-13.519
-9.91%
1 gen 2009 anni
98.913
-24.044
-19.55%
1 gen 2010 anni
138.371
+39.458
39.89%
1 gen 2011 anni
66.43
-71.94
-51.99%
1 gen 2012 anni
116.266
+49.836
75.02%
1 gen 2013 anni
116.266
0.0
0.0%
Classificazione dei paesi secondo i statistiche attuali per anni