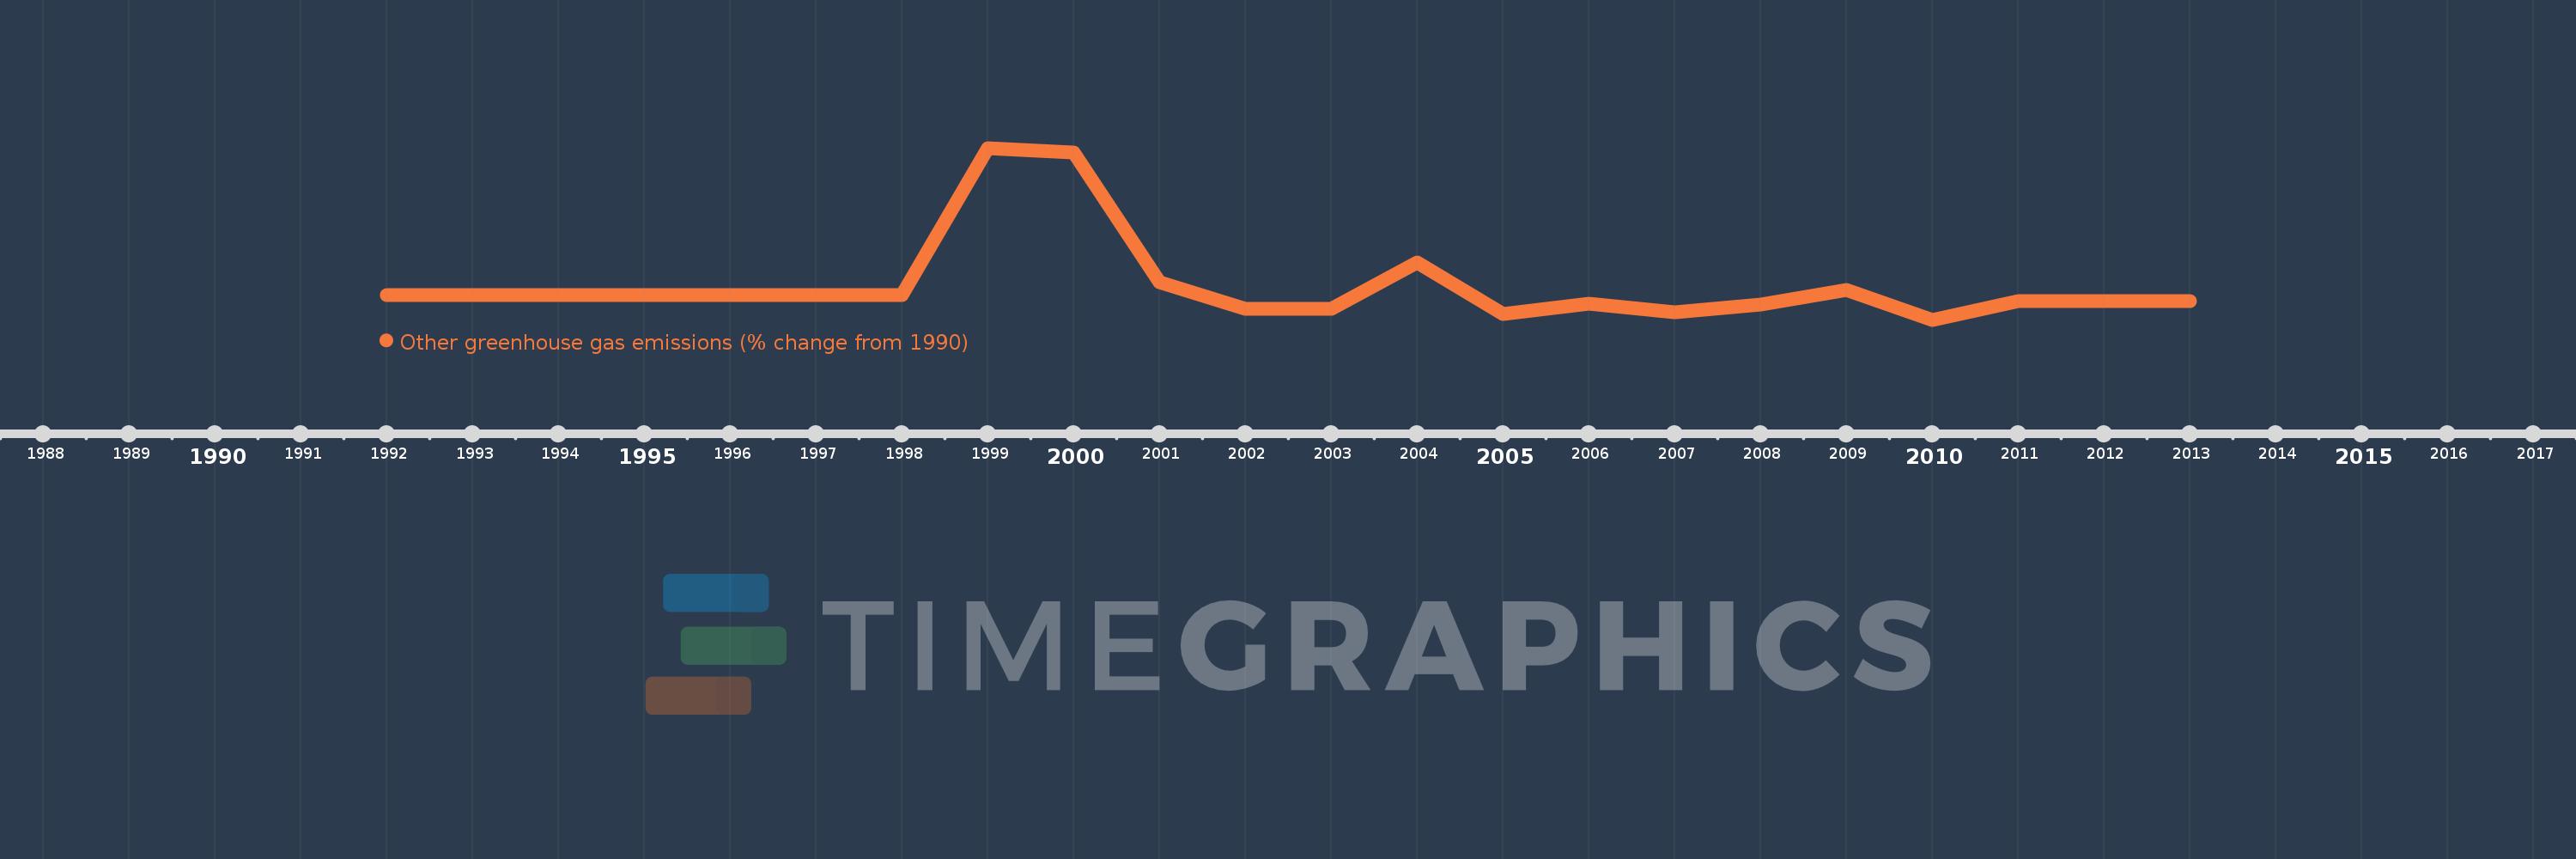
Questa scala temporale mostra un grafico dal 1992 anno al 2013 anno. Somalia. I dati fino ad 1991 anno non disponibili. Il numero di osservazioni attuali secondo i date: 22.
La fonte (nome):
Indicatori dello sviluppo mondiale
La fonte (organizzazione):
World Bank staff estimates from original source: European Commission, Joint Research Centre (JRC)/Netherlands Environmental Assessment Agency (PBL). Emission Database for Global Atmospheric Research (EDGAR): http://edgar.jrc.ec.europa.eu/.
Categorie:
Climate Change, Environment
sono stati aggiornati
23 apr 2017 anni
Indicatori delle variazioni dei valori per anni
In media:
37.747
Minima:
-91.135
1 gen 2010 anni
Massimo:
552.588
1 gen 1999 anni
Alla data di osservazione
Valore
Variazione assoluta
La variazione rispetto al valore precedente
1 gen 1992 anni
0.0
+0.0
0.0%
1 gen 1993 anni
0.0
+0.0
229.89%
1 gen 1994 anni
0.002
+0.001
312.46%
1 gen 1995 anni
0.004
+0.002
128.96%
1 gen 1996 anni
0.008
+0.004
106.83%
1 gen 1997 anni
0.031
+0.023
285.18%
1 gen 1998 anni
0.057
+0.026
82.62%
1 gen 1999 anni
552.588
+552.53
961.42 Mille.%
1 gen 2000 anni
534.137
-18.451
-3.34%
1 gen 2001 anni
50.782
-483.355
-90.49%
1 gen 2002 anni
-51.649
-102.431
-201.71%
1 gen 2003 anni
-49.629
+2.02
-3.91%
1 gen 2004 anni
124.986
+174.615
-351.84%
1 gen 2005 anni
-68.97
-193.956
-155.18%
1 gen 2006 anni
-31.018
+37.952
-55.03%
1 gen 2007 anni
-63.376
-32.358
104.32%
1 gen 2008 anni
-34.27
+29.106
-45.93%
1 gen 2009 anni
19.198
+53.468
-156.02%
1 gen 2010 anni
-91.135
-110.333
-574.7%
1 gen 2011 anni
-20.437
+70.698
-77.58%
1 gen 2012 anni
-20.437
+0.0
0.0%
1 gen 2013 anni
-20.437
0.0
0.0%
Classificazione dei paesi secondo i statistiche attuali per anni