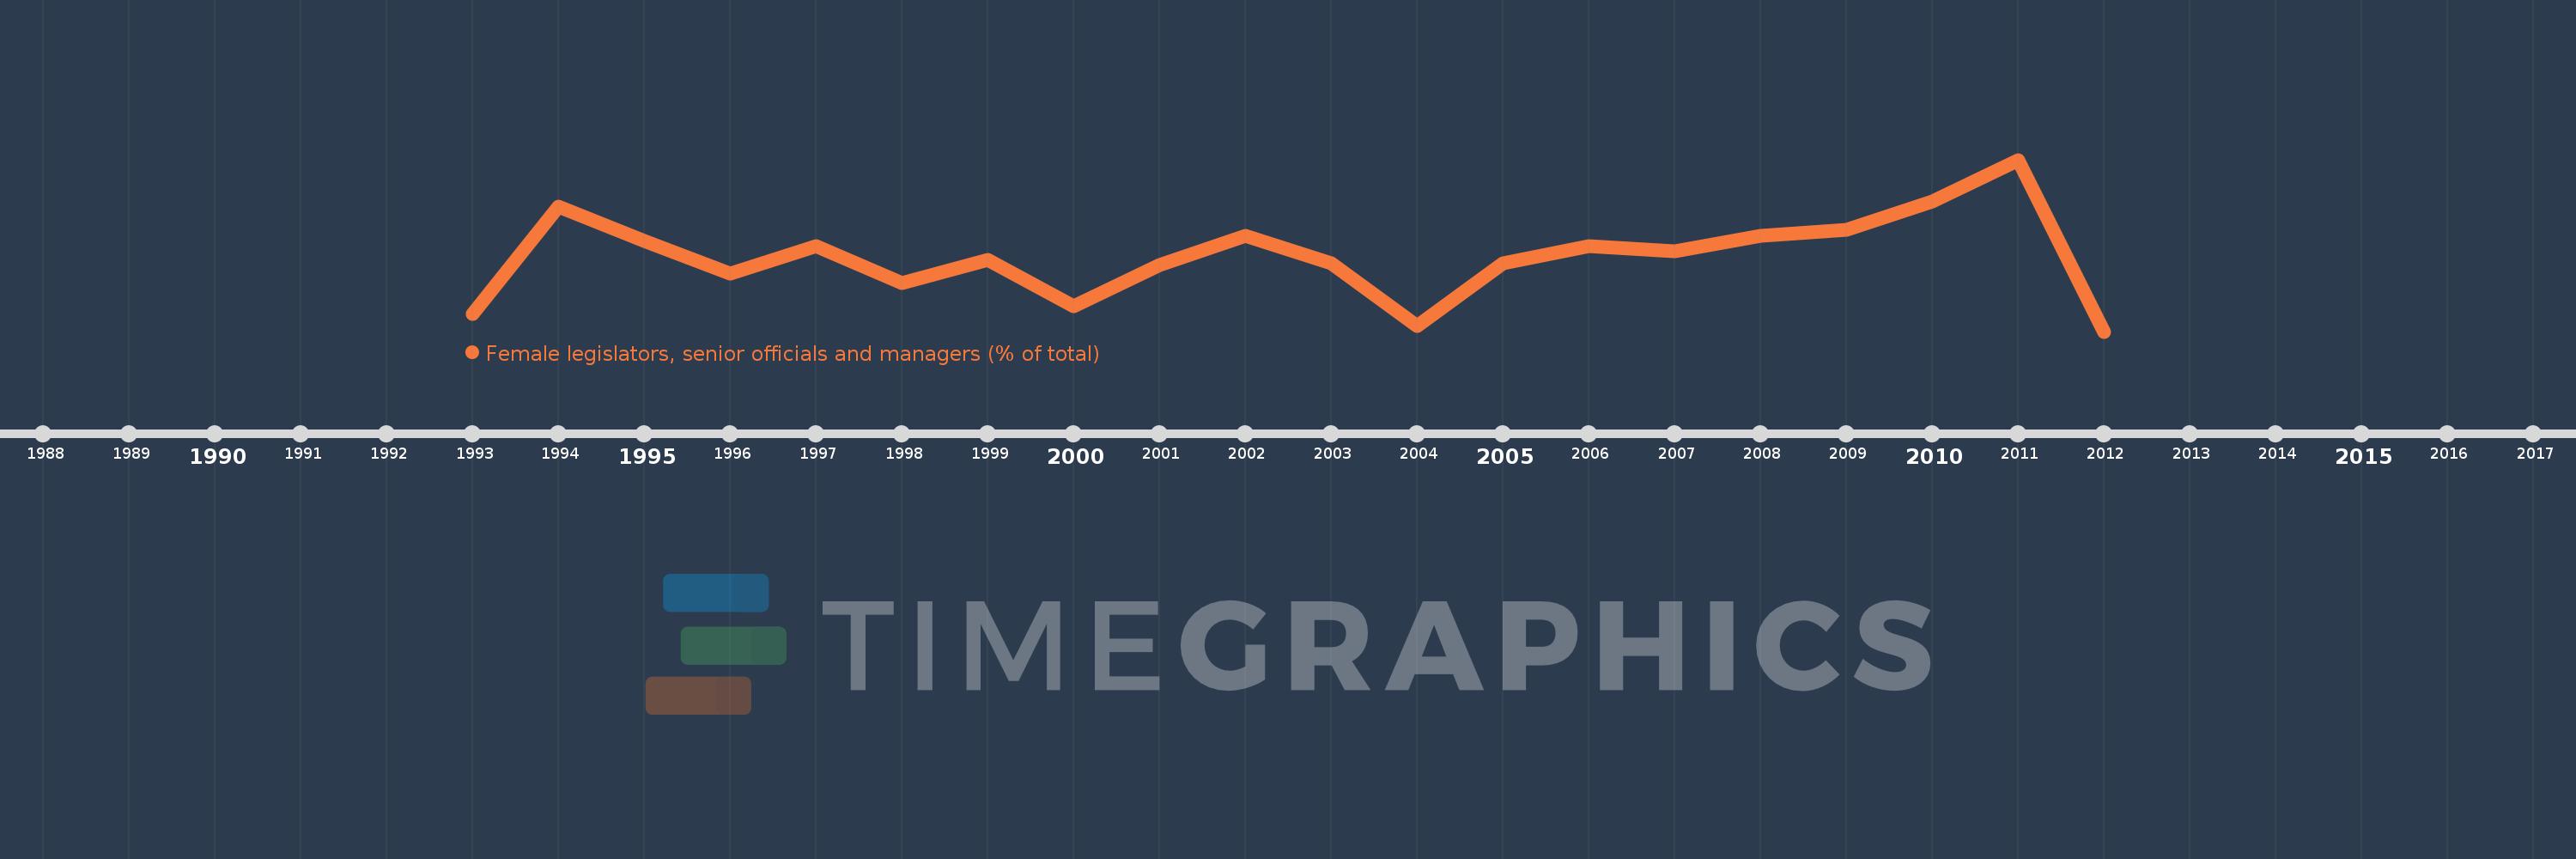
Questa scala temporale mostra un grafico dal 1993 anno al 2012 anno. Spain. I dati fino ad 1992 anno non disponibili. Il numero di osservazioni attuali secondo i date: 20.
La fonte (nome):
Indicatori dello sviluppo mondiale
La fonte (organizzazione):
ILO Key Indicators of the Labour Market (KILM).
Categorie:
Public Sector, Gender
sono stati aggiornati
23 apr 2017 anni
Indicatori delle variazioni dei valori per anni
In media:
31.744
Minima:
29.76
1 gen 2012 anni
Massimo:
34.333
1 gen 2011 anni
Alla data di osservazione
Valore
Variazione assoluta
La variazione rispetto al valore precedente
1 gen 1993 anni
30.23
+30.23
0.0%
1 gen 1994 anni
33.076
+2.846
9.41%
1 gen 1995 anni
32.177
-0.899
-2.72%
1 gen 1996 anni
31.297
-0.88
-2.74%
1 gen 1997 anni
32.032
+0.734
2.35%
1 gen 1998 anni
31.063
-0.969
-3.02%
1 gen 1999 anni
31.663
+0.6
1.93%
1 gen 2000 anni
30.43
-1.233
-3.89%
1 gen 2001 anni
31.534
+1.104
3.63%
1 gen 2002 anni
32.308
+0.774
2.46%
1 gen 2003 anni
31.571
-0.737
-2.28%
1 gen 2004 anni
29.9
-1.671
-5.29%
1 gen 2005 anni
31.578
+1.678
5.61%
1 gen 2006 anni
32.039
+0.461
1.46%
1 gen 2007 anni
31.892
-0.147
-0.46%
1 gen 2008 anni
32.309
+0.417
1.31%
1 gen 2009 anni
32.46
+0.151
0.47%
1 gen 2010 anni
33.223
+0.764
2.35%
1 gen 2011 anni
34.333
+1.109
3.34%
1 gen 2012 anni
29.76
-4.573
-13.32%
Classificazione dei paesi secondo i statistiche attuali per anni