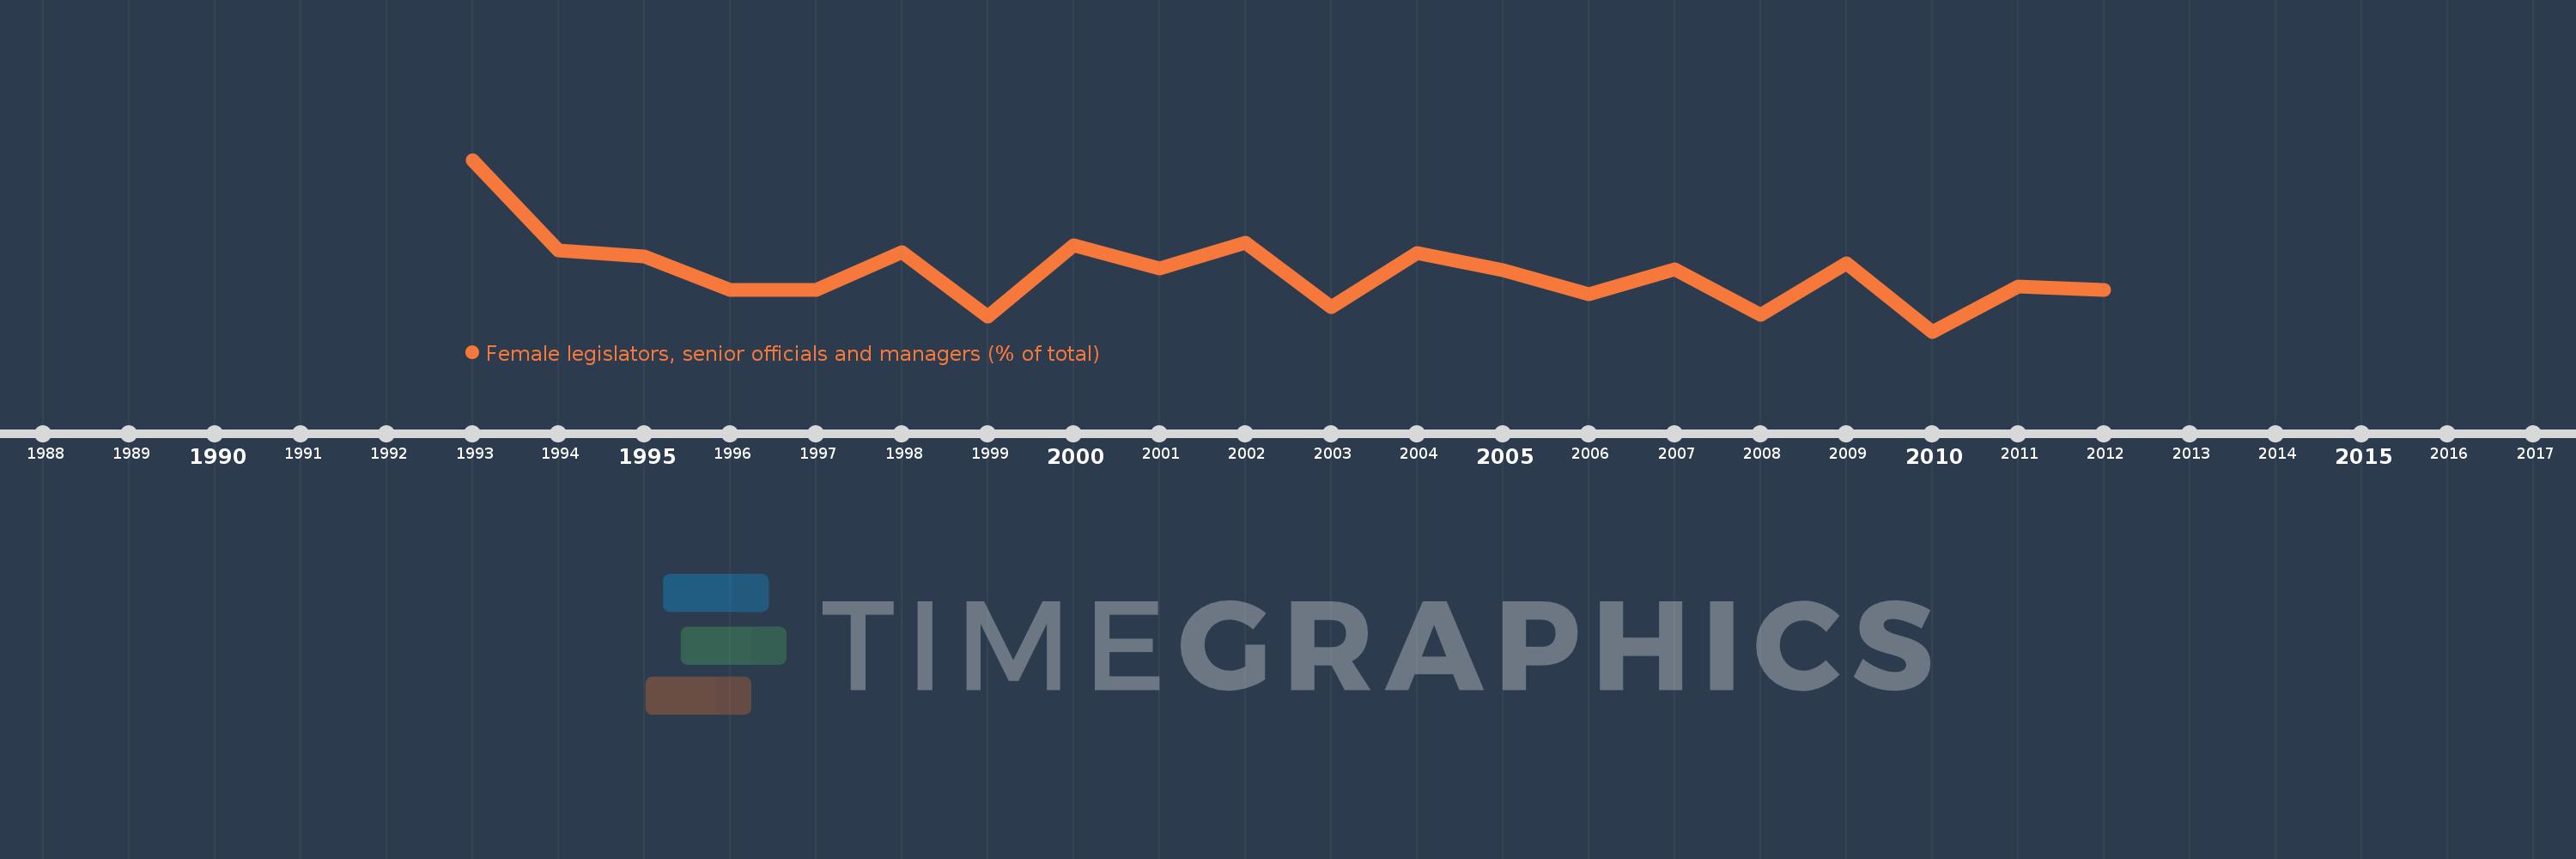
Questa scala temporale mostra un grafico dal 1993 anno al 2012 anno. Luxembourg. I dati fino ad 1992 anno non disponibili. Il numero di osservazioni attuali secondo i date: 20.
La fonte (nome):
Indicatori dello sviluppo mondiale
La fonte (organizzazione):
ILO Key Indicators of the Labour Market (KILM).
Categorie:
Public Sector, Gender
sono stati aggiornati
23 apr 2017 anni
Indicatori delle variazioni dei valori per anni
In media:
26.403
Minima:
19.097
1 gen 2010 anni
Massimo:
40.381
1 gen 1993 anni
Alla data di osservazione
Valore
Variazione assoluta
La variazione rispetto al valore precedente
1 gen 1993 anni
40.381
+40.381
0.0%
1 gen 1994 anni
29.114
-11.267
-27.9%
1 gen 1995 anni
28.366
-0.748
-2.57%
1 gen 1996 anni
24.297
-4.069
-14.34%
1 gen 1997 anni
24.281
-0.016
-0.07%
1 gen 1998 anni
28.951
+4.67
19.23%
1 gen 1999 anni
20.954
-7.997
-27.62%
1 gen 2000 anni
29.826
+8.872
42.34%
1 gen 2001 anni
26.915
-2.911
-9.76%
1 gen 2002 anni
30.149
+3.233
12.01%
1 gen 2003 anni
22.077
-8.071
-26.77%
1 gen 2004 anni
28.817
+6.74
30.53%
1 gen 2005 anni
26.702
-2.115
-7.34%
1 gen 2006 anni
23.772
-2.93
-10.97%
1 gen 2007 anni
26.76
+2.988
12.57%
1 gen 2008 anni
21.17
-5.59
-20.89%
1 gen 2009 anni
27.523
+6.353
30.01%
1 gen 2010 anni
19.097
-8.426
-30.61%
1 gen 2011 anni
24.696
+5.599
29.32%
1 gen 2012 anni
24.211
-0.485
-1.97%
Classificazione dei paesi secondo i statistiche attuali per anni