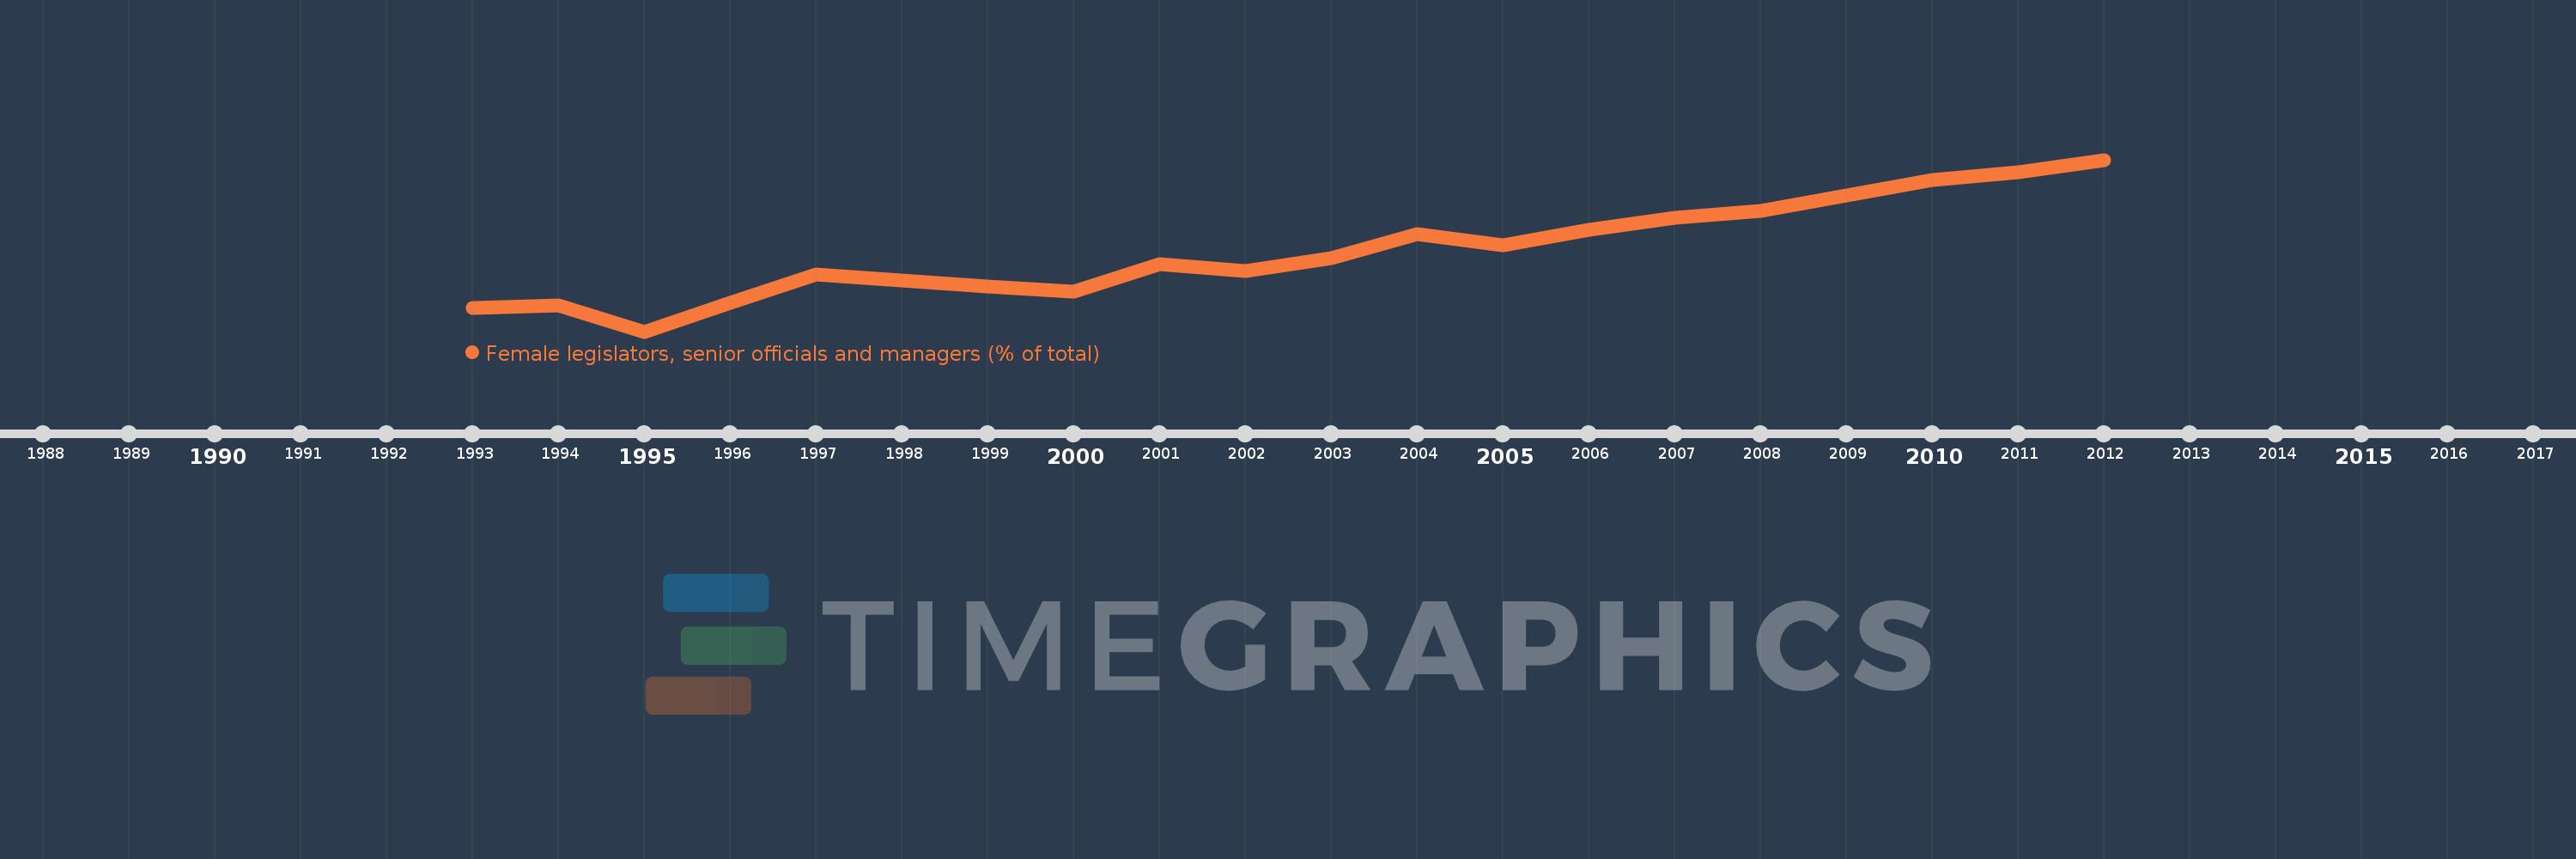
Questa scala temporale mostra un grafico dal 1993 anno al 2012 anno. Germany. I dati fino ad 1992 anno non disponibili. Il numero di osservazioni attuali secondo i date: 20.
La fonte (nome):
Indicatori dello sviluppo mondiale
La fonte (organizzazione):
ILO Key Indicators of the Labour Market (KILM).
Categorie:
Public Sector, Gender
sono stati aggiornati
23 apr 2017 anni
Indicatori delle variazioni dei valori per anni
In media:
27.525
Minima:
25.106
1 gen 1995 anni
Massimo:
30.256
1 gen 2012 anni
Alla data di osservazione
Valore
Variazione assoluta
La variazione rispetto al valore precedente
1 gen 1993 anni
25.82
+25.82
0.0%
1 gen 1994 anni
25.903
+0.083
0.32%
1 gen 1995 anni
25.106
-0.797
-3.08%
1 gen 1996 anni
25.961
+0.855
3.41%
1 gen 1997 anni
26.828
+0.866
3.34%
1 gen 1998 anni
26.628
-0.2
-0.75%
1 gen 1999 anni
26.447
-0.181
-0.68%
1 gen 2000 anni
26.316
-0.131
-0.5%
1 gen 2001 anni
27.125
+0.809
3.07%
1 gen 2002 anni
26.92
-0.205
-0.76%
1 gen 2003 anni
27.295
+0.374
1.39%
1 gen 2004 anni
28.04
+0.745
2.73%
1 gen 2005 anni
27.706
-0.334
-1.19%
1 gen 2006 anni
28.166
+0.46
1.66%
1 gen 2007 anni
28.513
+0.347
1.23%
1 gen 2008 anni
28.734
+0.221
0.77%
1 gen 2009 anni
29.187
+0.453
1.58%
1 gen 2010 anni
29.661
+0.474
1.63%
1 gen 2011 anni
29.891
+0.229
0.77%
1 gen 2012 anni
30.256
+0.366
1.22%
Classificazione dei paesi secondo i statistiche attuali per anni