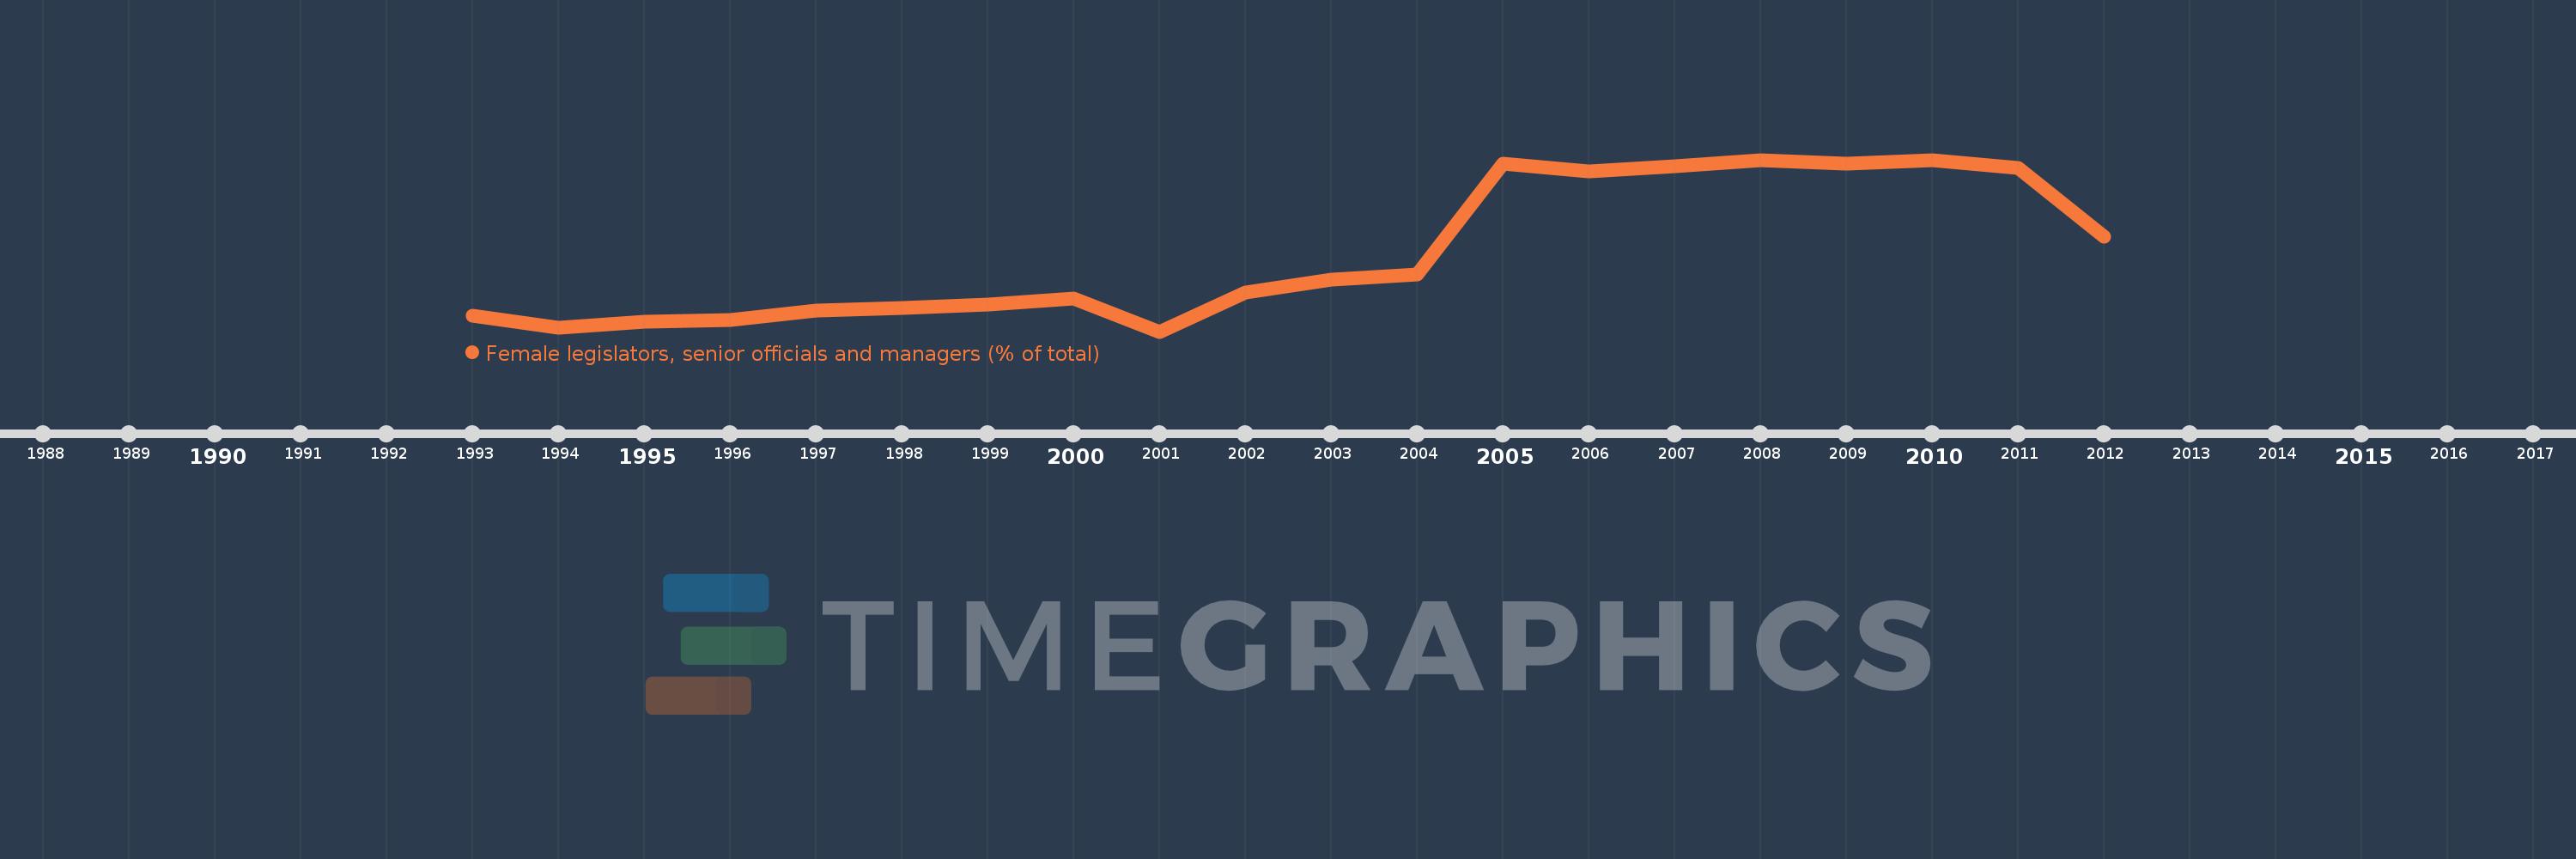
Questa scala temporale mostra un grafico dal 1993 anno al 2012 anno. Italy. I dati fino ad 1992 anno non disponibili. Il numero di osservazioni attuali secondo i date: 20.
La fonte (nome):
Indicatori dello sviluppo mondiale
La fonte (organizzazione):
ILO Key Indicators of the Labour Market (KILM).
Categorie:
Public Sector, Gender
sono stati aggiornati
23 apr 2017 anni
Indicatori delle variazioni dei valori per anni
In media:
23.141
Minima:
14.324
1 gen 2001 anni
Massimo:
33.784
1 gen 2010 anni
Alla data di osservazione
Valore
Variazione assoluta
La variazione rispetto al valore precedente
1 gen 1993 anni
16.17
+16.17
0.0%
1 gen 1994 anni
14.759
-1.411
-8.73%
1 gen 1995 anni
15.43
+0.671
4.55%
1 gen 1996 anni
15.665
+0.235
1.53%
1 gen 1997 anni
16.732
+1.067
6.81%
1 gen 1998 anni
16.966
+0.234
1.4%
1 gen 1999 anni
17.398
+0.431
2.54%
1 gen 2000 anni
18.048
+0.651
3.74%
1 gen 2001 anni
14.324
-3.725
-20.64%
1 gen 2002 anni
18.747
+4.423
30.88%
1 gen 2003 anni
20.182
+1.435
7.66%
1 gen 2004 anni
20.838
+0.656
3.25%
1 gen 2005 anni
33.304
+12.465
59.82%
1 gen 2006 anni
32.497
-0.807
-2.42%
1 gen 2007 anni
33.008
+0.512
1.57%
1 gen 2008 anni
33.697
+0.689
2.09%
1 gen 2009 anni
33.392
-0.305
-0.9%
1 gen 2010 anni
33.784
+0.392
1.17%
1 gen 2011 anni
32.848
-0.936
-2.77%
1 gen 2012 anni
25.028
-7.821
-23.81%
Classificazione dei paesi secondo i statistiche attuali per anni