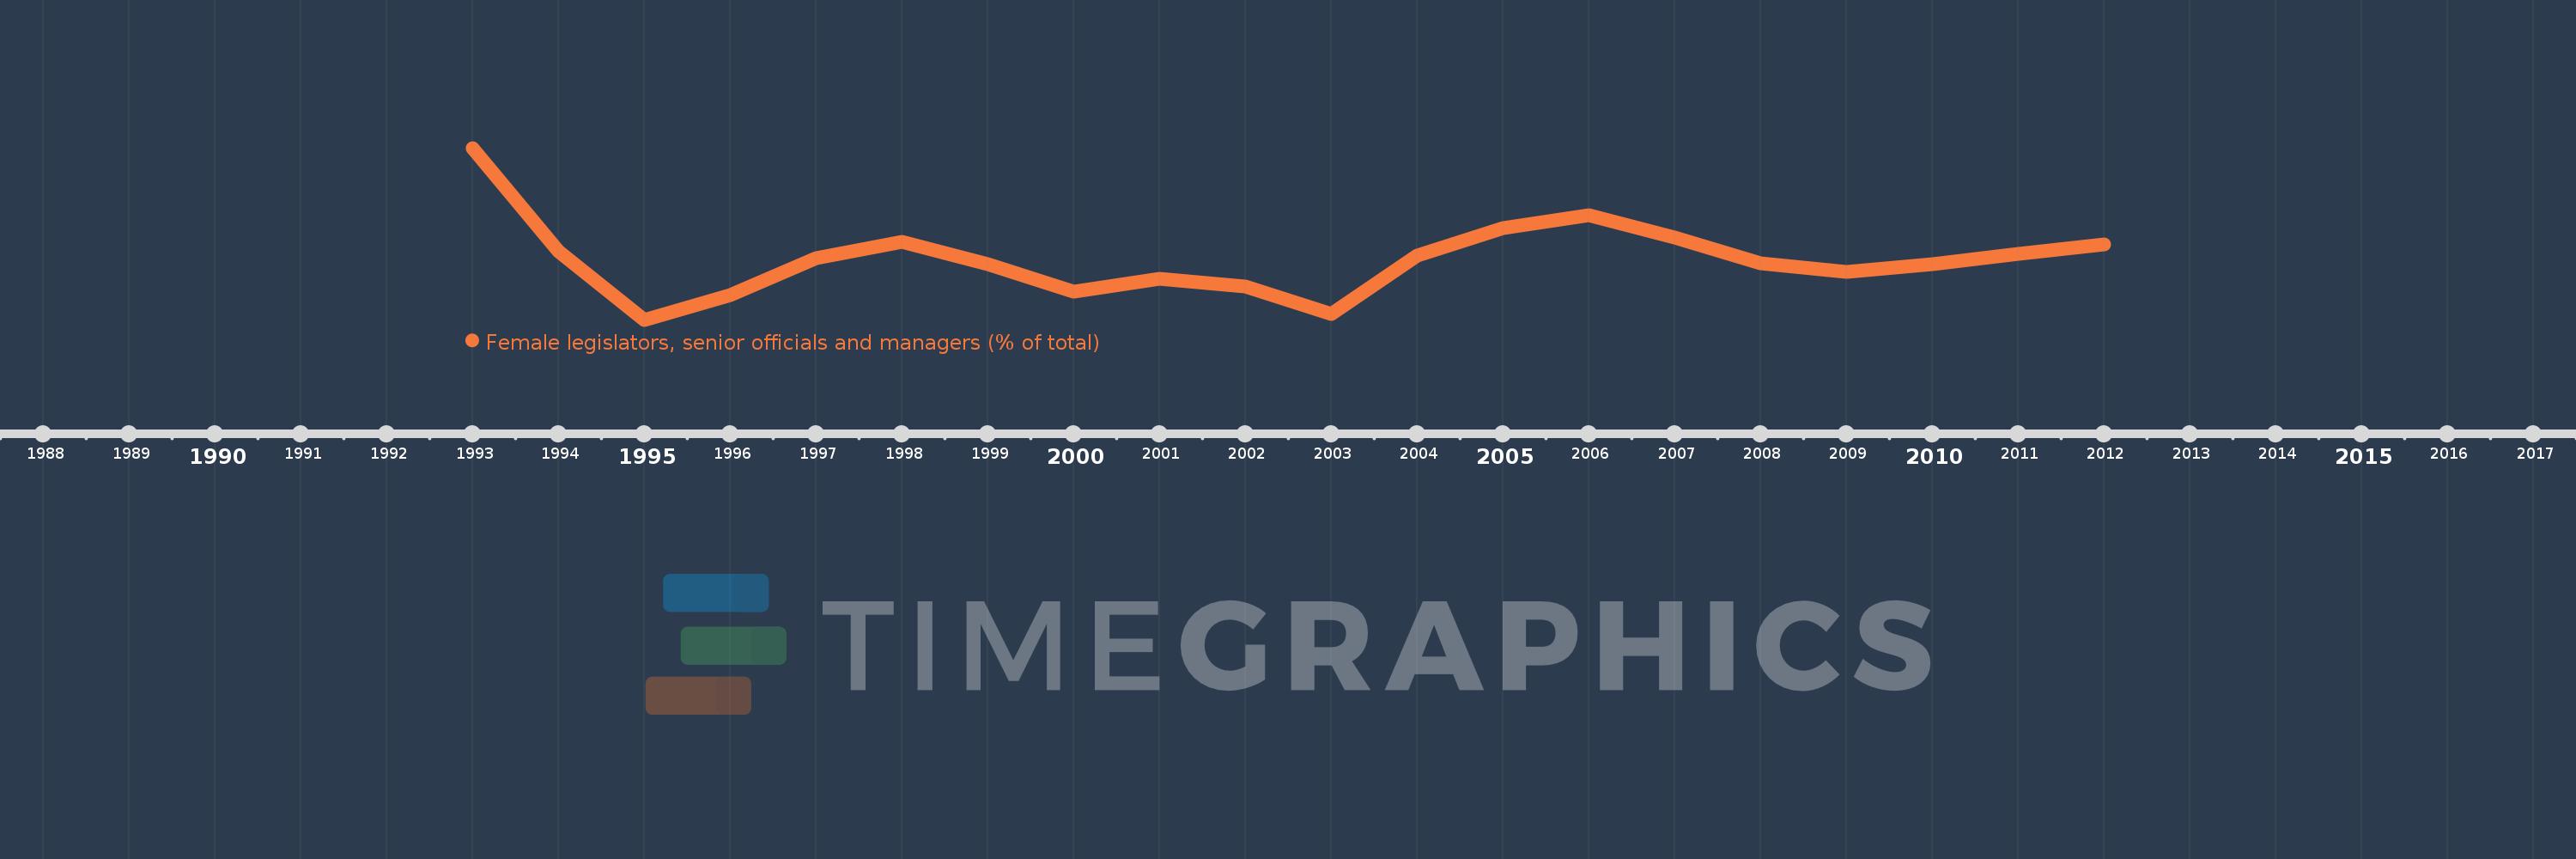
Questa scala temporale mostra un grafico dal 1993 anno al 2012 anno. Portugal. I dati fino ad 1992 anno non disponibili. Il numero di osservazioni attuali secondo i date: 20.
La fonte (nome):
Indicatori dello sviluppo mondiale
La fonte (organizzazione):
ILO Key Indicators of the Labour Market (KILM).
Categorie:
Public Sector, Gender
sono stati aggiornati
23 apr 2017 anni
Indicatori delle variazioni dei valori per anni
In media:
32.029
Minima:
29.244
1 gen 1995 anni
Massimo:
37.14
1 gen 1993 anni
Alla data di osservazione
Valore
Variazione assoluta
La variazione rispetto al valore precedente
1 gen 1993 anni
37.14
+37.14
0.0%
1 gen 1994 anni
32.404
-4.736
-12.75%
1 gen 1995 anni
29.244
-3.161
-9.75%
1 gen 1996 anni
30.393
+1.15
3.93%
1 gen 1997 anni
32.071
+1.678
5.52%
1 gen 1998 anni
32.824
+0.753
2.35%
1 gen 1999 anni
31.784
-1.041
-3.17%
1 gen 2000 anni
30.538
-1.246
-3.92%
1 gen 2001 anni
31.108
+0.57
1.87%
1 gen 2002 anni
30.774
-0.335
-1.08%
1 gen 2003 anni
29.502
-1.272
-4.13%
1 gen 2004 anni
32.2
+2.698
9.14%
1 gen 2005 anni
33.457
+1.257
3.9%
1 gen 2006 anni
34.062
+0.605
1.81%
1 gen 2007 anni
33.032
-1.03
-3.03%
1 gen 2008 anni
31.834
-1.198
-3.63%
1 gen 2009 anni
31.453
-0.38
-1.2%
1 gen 2010 anni
31.784
+0.331
1.05%
1 gen 2011 anni
32.28
+0.496
1.56%
1 gen 2012 anni
32.688
+0.409
1.27%
Classificazione dei paesi secondo i statistiche attuali per anni