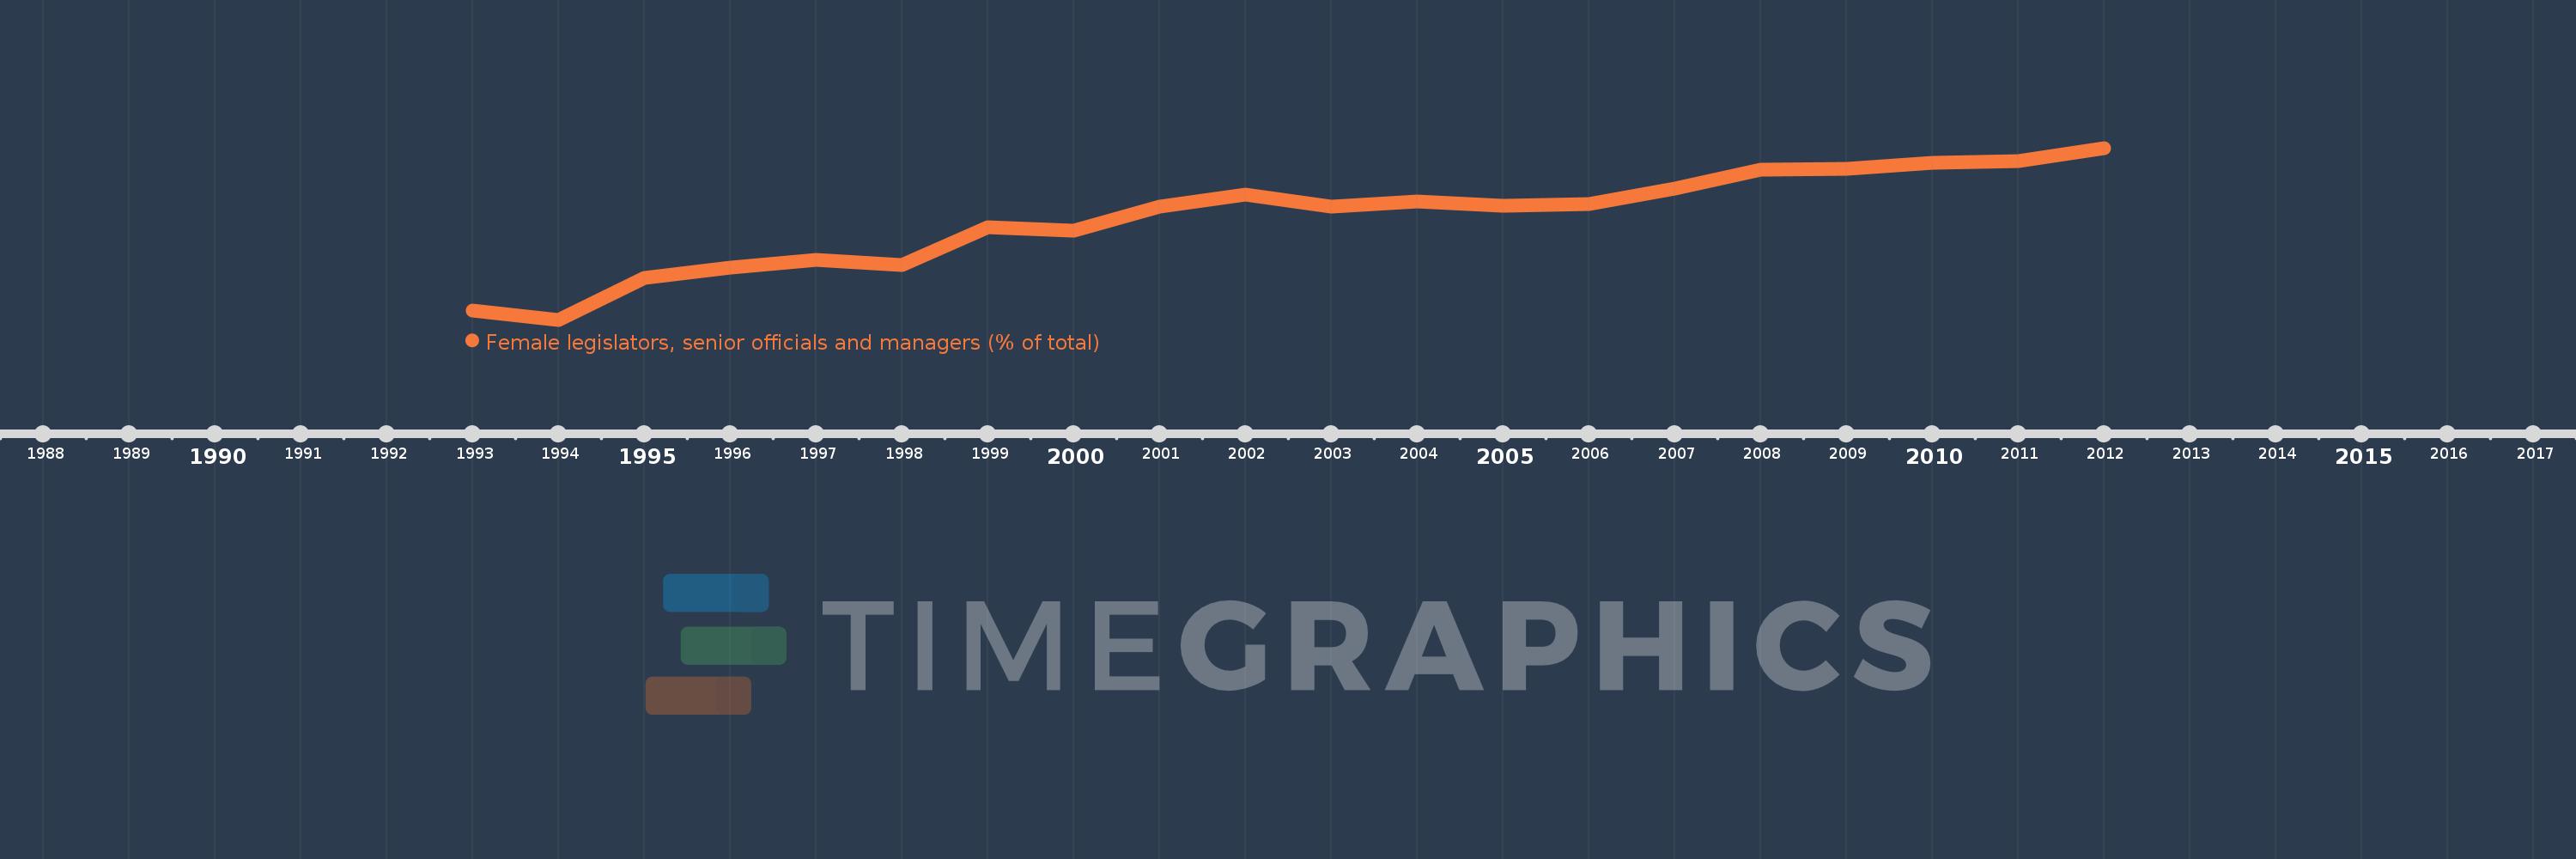
Questa scala temporale mostra un grafico dal 1993 anno al 2012 anno. Netherlands. I dati fino ad 1992 anno non disponibili. Il numero di osservazioni attuali secondo i date: 20.
La fonte (nome):
Indicatori dello sviluppo mondiale
La fonte (organizzazione):
ILO Key Indicators of the Labour Market (KILM).
Categorie:
Public Sector, Gender
sono stati aggiornati
23 apr 2017 anni
Indicatori delle variazioni dei valori per anni
In media:
24.433
Minima:
17.1
1 gen 1994 anni
Massimo:
29.582
1 gen 2012 anni
Alla data di osservazione
Valore
Variazione assoluta
La variazione rispetto al valore precedente
1 gen 1993 anni
17.743
+17.743
0.0%
1 gen 1994 anni
17.1
-0.643
-3.62%
1 gen 1995 anni
20.152
+3.052
17.85%
1 gen 1996 anni
20.873
+0.721
3.58%
1 gen 1997 anni
21.455
+0.582
2.79%
1 gen 1998 anni
21.068
-0.387
-1.8%
1 gen 1999 anni
23.802
+2.734
12.98%
1 gen 2000 anni
23.599
-0.202
-0.85%
1 gen 2001 anni
25.33
+1.73
7.33%
1 gen 2002 anni
26.178
+0.849
3.35%
1 gen 2003 anni
25.349
-0.829
-3.17%
1 gen 2004 anni
25.669
+0.32
1.26%
1 gen 2005 anni
25.4
-0.269
-1.05%
1 gen 2006 anni
25.533
+0.133
0.52%
1 gen 2007 anni
26.661
+1.128
4.42%
1 gen 2008 anni
27.99
+1.329
4.98%
1 gen 2009 anni
28.079
+0.088
0.32%
1 gen 2010 anni
28.485
+0.406
1.45%
1 gen 2011 anni
28.604
+0.119
0.42%
1 gen 2012 anni
29.582
+0.978
3.42%
Classificazione dei paesi secondo i statistiche attuali per anni