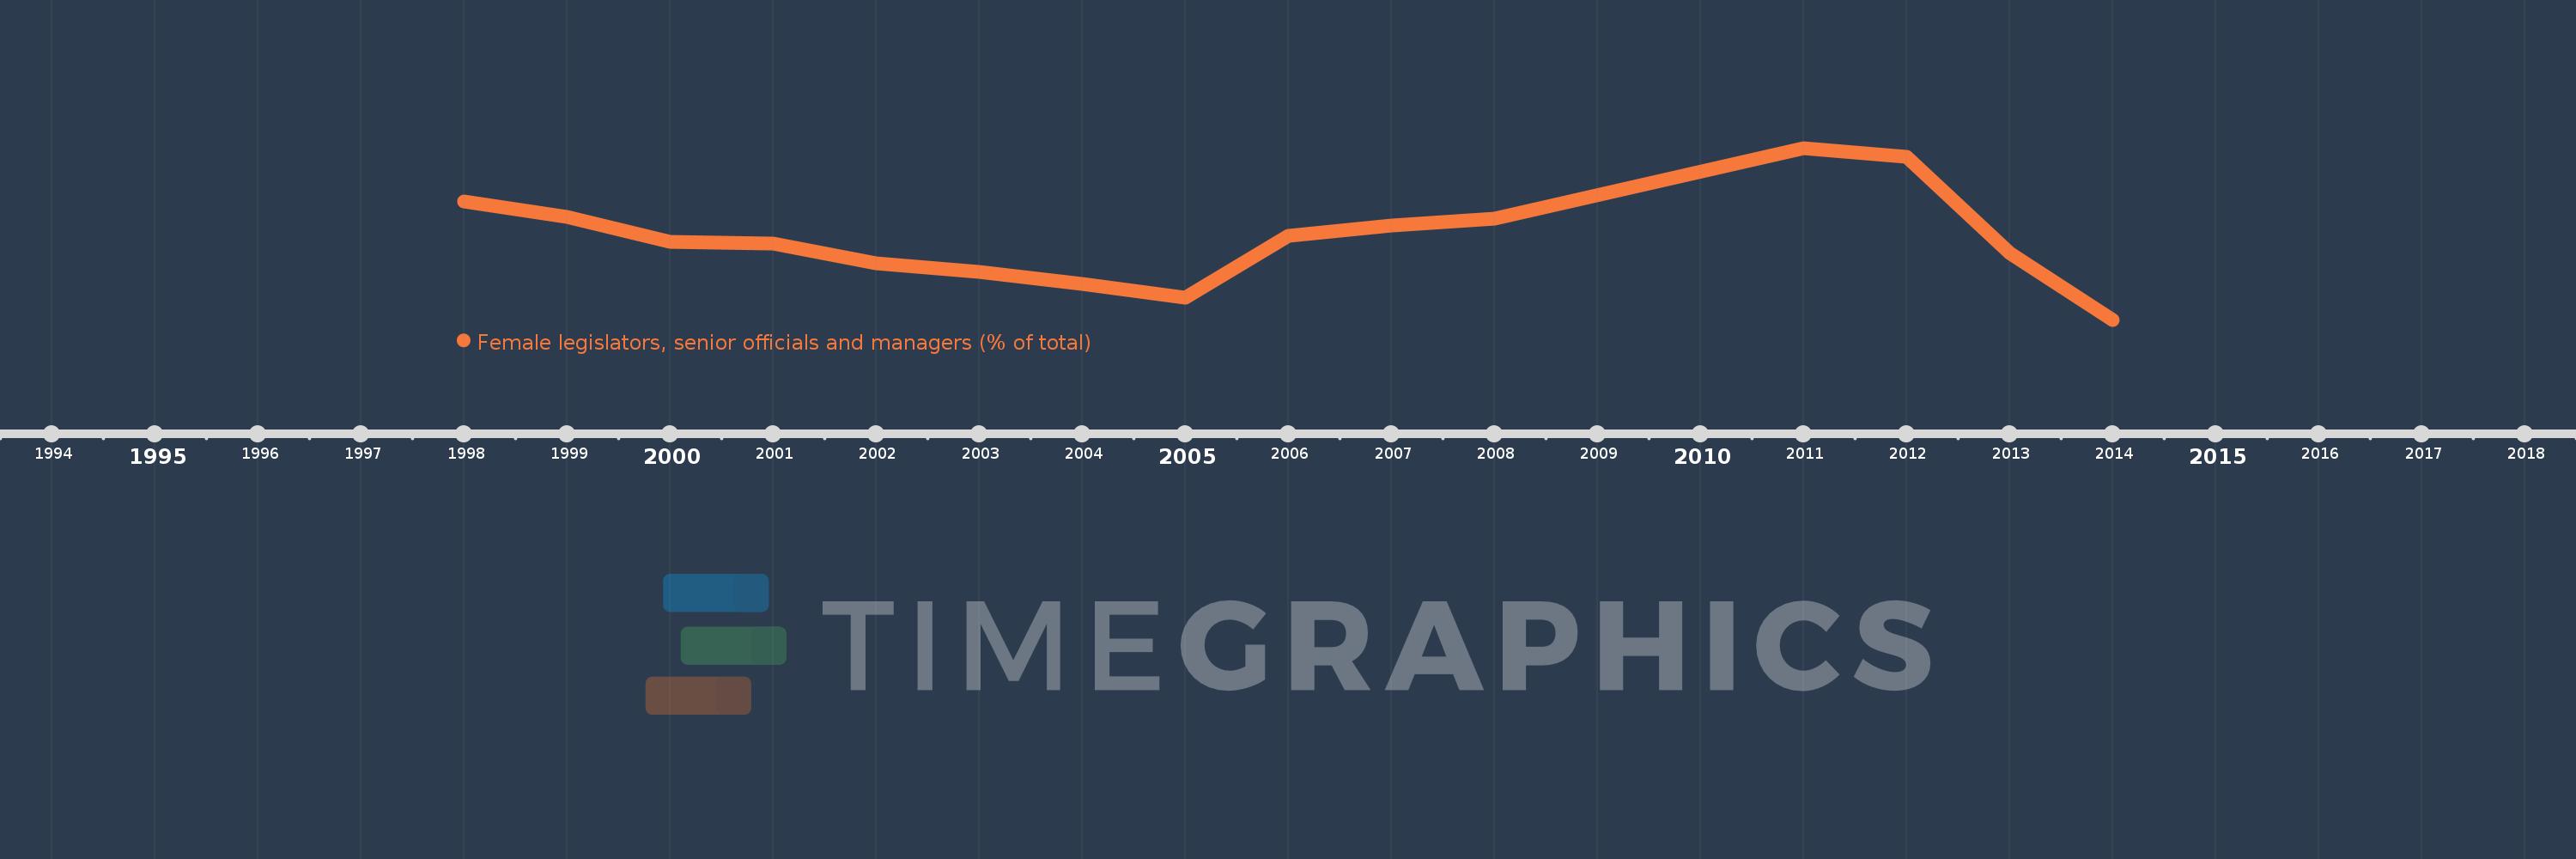
Questa scala temporale mostra un grafico dal 1998 anno al 2014 anno. Egypt, Arab Rep.. I dati fino ad 1997 anno non disponibili. Il numero di osservazioni attuali secondo i date: 15.
La fonte (nome):
Indicatori dello sviluppo mondiale
La fonte (organizzazione):
ILO Key Indicators of the Labour Market (KILM).
Categorie:
Public Sector, Gender
sono stati aggiornati
23 apr 2017 anni
Indicatori delle variazioni dei valori per anni
In media:
10.316
Minima:
7.123
1 gen 2014 anni
Massimo:
13.877
1 gen 2011 anni
Alla data di osservazione
Valore
Variazione assoluta
La variazione rispetto al valore precedente
1 gen 1998 anni
11.783
+11.783
0.0%
1 gen 1999 anni
11.17
-0.614
-5.21%
1 gen 2000 anni
10.186
-0.984
-8.81%
1 gen 2001 anni
10.113
-0.073
-0.72%
1 gen 2002 anni
9.336
-0.777
-7.69%
1 gen 2003 anni
9.002
-0.334
-3.58%
1 gen 2004 anni
8.529
-0.472
-5.25%
1 gen 2005 anni
7.998
-0.532
-6.23%
1 gen 2006 anni
10.422
+2.424
30.31%
1 gen 2007 anni
10.835
+0.413
3.96%
1 gen 2008 anni
11.11
+0.275
2.54%
1 gen 2011 anni
13.877
+2.766
24.9%
1 gen 2012 anni
13.514
-0.363
-2.62%
1 gen 2013 anni
9.74
-3.774
-27.92%
1 gen 2014 anni
7.123
-2.617
-26.87%
Classificazione dei paesi secondo i statistiche attuali per anni