29
/fr/
fr
AIzaSyAYiBZKx7MnpbEhh9jyipgxe19OcubqV5w
April 1, 2024
97768
Cabo Verde
CPV
true
2
1
Percentage of teachers in primary education who are trained, both sexes (%)
2015,2013,2012,2011,2010,2009,2008,2007,2006,2005,2004,2003
Download
Bibliothèque de statistiques globales →Cabo Verde →

Percentage of teachers in primary education who are trained, both sexes (%)

Cette statistique dans les autres pays:
AlgeriaAndorraAngolaAntigua and BarbudaArab WorldArmeniaArubaAzerbaijanBahamas, TheBahrainBangladeshBarbadosBelarusBelizeBeninBermudaBhutanBoliviaBotswanaBritish Virgin IslandsBrunei DarussalamBurkina FasoBurundiCabo VerdeCambodiaCameroonCaribbean small statesCayman IslandsCentral African RepublicChadColombiaComorosCongo, Dem. Rep.Congo, Rep.Costa RicaCote d'IvoireCroatiaCubaDjiboutiDominicaDominican RepublicEarly-demographic dividendEcuadorEgypt, Arab Rep.El SalvadorEquatorial GuineaEritreaEthiopiaEurope & Central Asia (excluding high income)FijiFragile and conflict affected situationsGabonGambia, TheGeorgiaGhanaGibraltarGrenadaGuineaGuinea-BissauGuyanaHeavily indebted poor countries (HIPC)HondurasHong Kong SAR, ChinaIDA blendIDA onlyIDA totalIran, Islamic Rep.IraqJamaicaKazakhstanKenyaKiribatiKuwaitKyrgyz RepublicLao PDRLatin America & Caribbean Latin America & Caribbean (excluding high income)Latin America & the Caribbean (IDA & IBRD countries)Least developed countries: UN classificationLebanonLesothoLiberiaLow incomeLower middle incomeMacao SAR, ChinaMadagascarMalawiMalaysiaMaldivesMaliMauritaniaMauritiusMexicoMiddle East & North AfricaMiddle East & North Africa (excluding high income)Middle East & North Africa (IDA & IBRD countries)MoldovaMongoliaMoroccoMozambiqueMyanmarNamibiaNauruNepalNicaraguaNigerNigeriaOmanOther small statesPacific island small statesPakistanPanamaParaguayPhilippinesPre-demographic dividendQatarRwandaSao Tome and PrincipeSaudi ArabiaSenegalSerbiaSeychellesSierra LeoneSingaporeSmall statesSolomon IslandsSouth AfricaSouth SudanSri LankaSt. Kitts and NevisSt. LuciaSt. Vincent and the GrenadinesSub-Saharan Africa Sub-Saharan Africa (excluding high income)Sub-Saharan Africa (IDA & IBRD countries)SurinameSwazilandSyrian Arab RepublicTajikistanTanzaniaThailandTogoTongaTrinidad and TobagoTunisiaTurks and Caicos IslandsUgandaUkraineUnited Arab EmiratesUzbekistanVanuatuVietnamWest Bank and GazaZambiaZimbabwe
La ligne de temps
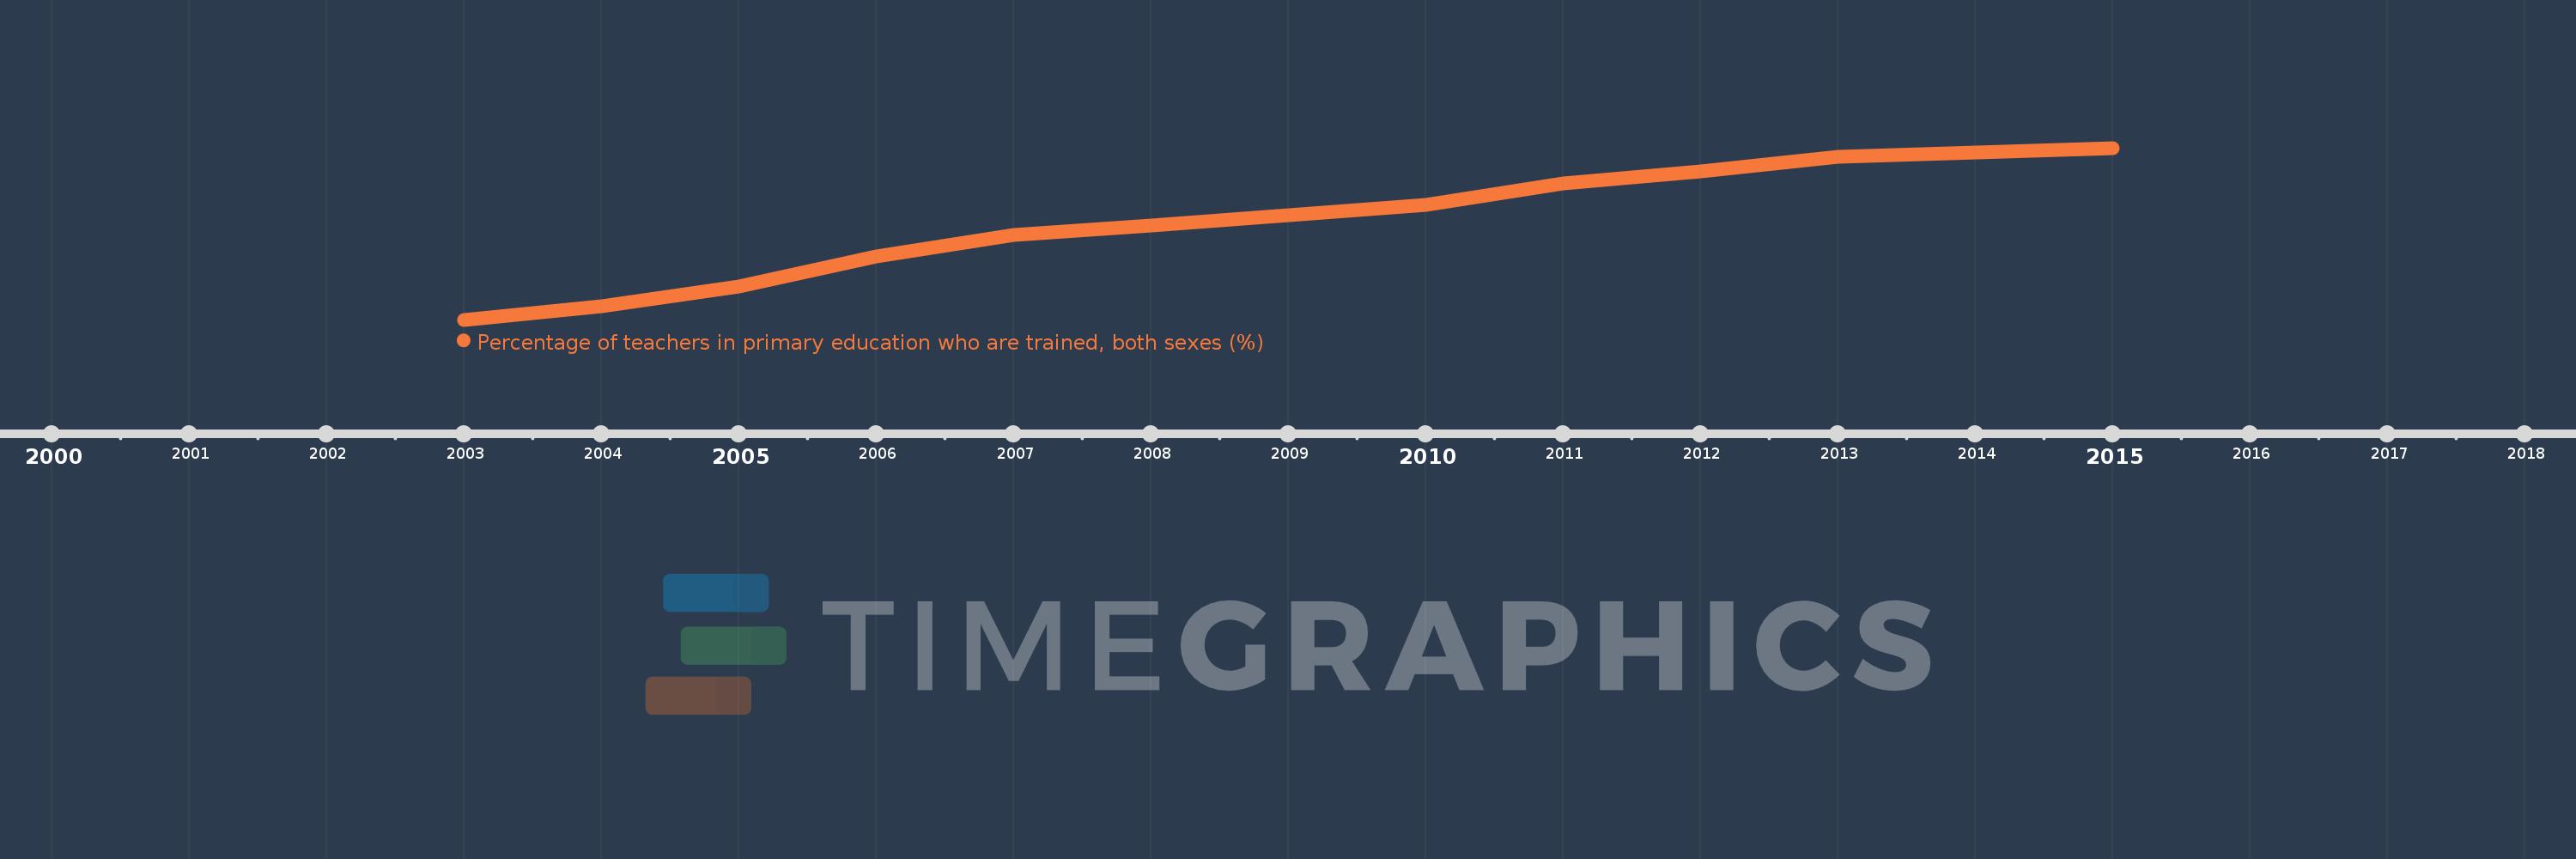
Cette échelle de temps montre un graphique de 2003 année à 2015 année Cabo Verde. Les données jusqu'à 2002 année ne sont pas présentés. Quantité d'observations actuelles selon dates: 12.
Source (désignation):
Les indicateurs du développement mondiale
Source (organisation):
United Nations Educational, Scientific, and Cultural Organization (UNESCO) Institute for Statistics.
Catégories:
Education
Dernière mise à jour
23 avr. 2017
Les indicateurs de changement de valeurs selon les années
En moyenne:
82.945
Minimum:
67.158
1 janv. 2003
Maximum:
96.02
1 janv. 2015
Pour la date d''observation
Valeur
Changement absolu
Le changement par rapport à la valeur précédente
1 janv. 2003
67.158
+67.158
0.0%
1 janv. 2004
69.38
+2.222
3.31%
1 janv. 2005
72.704
+3.324
4.79%
1 janv. 2006
77.806
+5.101
7.02%
1 janv. 2007
81.464
+3.659
4.7%
1 janv. 2008
82.934
+1.47
1.8%
1 janv. 2009
84.706
+1.773
2.14%
1 janv. 2010
86.458
+1.752
2.07%
1 janv. 2011
90.03
+3.572
4.13%
1 janv. 2012
92.093
+2.063
2.29%
1 janv. 2013
94.587
+2.494
2.71%
1 janv. 2015
96.02
+1.433
1.51%
Classement des pays selon les statistiques actuelles par années

Commentaires:

Envoyer
PremiumAbout & FeedbackUn accordConfidentialité
logo
© 2022 Selected Technologies LLC – Morgan Hill, California