29
/fr/
fr
AIzaSyAYiBZKx7MnpbEhh9jyipgxe19OcubqV5w
April 1, 2024
255599
Swaziland
SWZ
true
2
1
Percentage of teachers in primary education who are trained, both sexes (%)
2014,2013,2012,2011,2010,2008,2007,2006,2005,2004,2003,2001,2000
Download
Bibliothèque de statistiques globales →Swaziland →

Percentage of teachers in primary education who are trained, both sexes (%)

Cette statistique dans les autres pays:
AlgeriaAndorraAngolaAntigua and BarbudaArab WorldArmeniaArubaAzerbaijanBahamas, TheBahrainBangladeshBarbadosBelarusBelizeBeninBermudaBhutanBoliviaBotswanaBritish Virgin IslandsBrunei DarussalamBurkina FasoBurundiCabo VerdeCambodiaCameroonCaribbean small statesCayman IslandsCentral African RepublicChadColombiaComorosCongo, Dem. Rep.Congo, Rep.Costa RicaCote d'IvoireCroatiaCubaDjiboutiDominicaDominican RepublicEarly-demographic dividendEcuadorEgypt, Arab Rep.El SalvadorEquatorial GuineaEritreaEthiopiaEurope & Central Asia (excluding high income)FijiFragile and conflict affected situationsGabonGambia, TheGeorgiaGhanaGibraltarGrenadaGuineaGuinea-BissauGuyanaHeavily indebted poor countries (HIPC)HondurasHong Kong SAR, ChinaIDA blendIDA onlyIDA totalIran, Islamic Rep.IraqJamaicaKazakhstanKenyaKiribatiKuwaitKyrgyz RepublicLao PDRLatin America & Caribbean Latin America & Caribbean (excluding high income)Latin America & the Caribbean (IDA & IBRD countries)Least developed countries: UN classificationLebanonLesothoLiberiaLow incomeLower middle incomeMacao SAR, ChinaMadagascarMalawiMalaysiaMaldivesMaliMauritaniaMauritiusMexicoMiddle East & North AfricaMiddle East & North Africa (excluding high income)Middle East & North Africa (IDA & IBRD countries)MoldovaMongoliaMoroccoMozambiqueMyanmarNamibiaNauruNepalNicaraguaNigerNigeriaOmanOther small statesPacific island small statesPakistanPanamaParaguayPhilippinesPre-demographic dividendQatarRwandaSao Tome and PrincipeSaudi ArabiaSenegalSerbiaSeychellesSierra LeoneSingaporeSmall statesSolomon IslandsSouth AfricaSouth SudanSri LankaSt. Kitts and NevisSt. LuciaSt. Vincent and the GrenadinesSub-Saharan Africa Sub-Saharan Africa (excluding high income)Sub-Saharan Africa (IDA & IBRD countries)SurinameSwazilandSyrian Arab RepublicTajikistanTanzaniaThailandTogoTongaTrinidad and TobagoTunisiaTurks and Caicos IslandsUgandaUkraineUnited Arab EmiratesUzbekistanVanuatuVietnamWest Bank and GazaZambiaZimbabwe
La ligne de temps
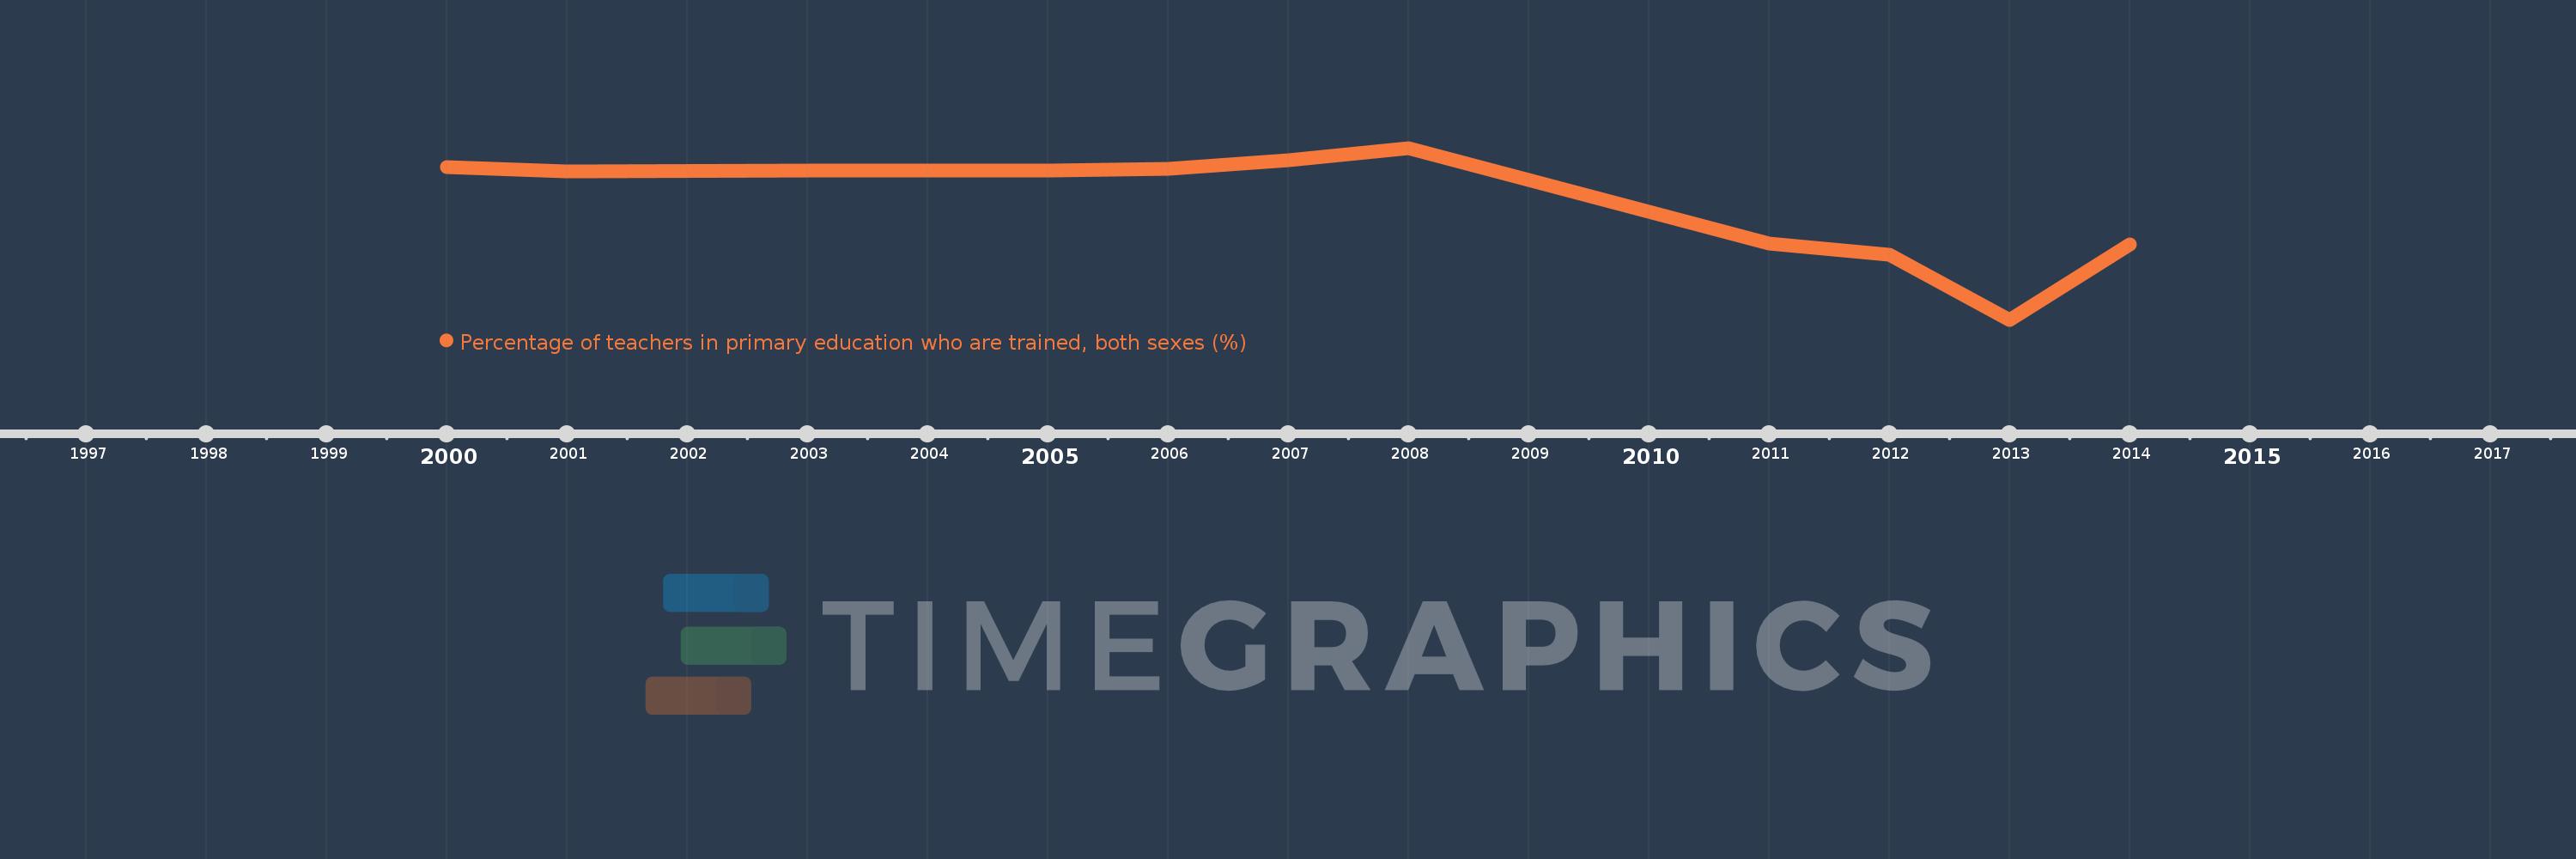
Cette échelle de temps montre un graphique de 2000 année à 2014 année Swaziland. Les données jusqu'à 1999 année ne sont pas présentés. Quantité d'observations actuelles selon dates: 13.
Source (désignation):
Les indicateurs du développement mondiale
Source (organisation):
United Nations Educational, Scientific, and Cultural Organization (UNESCO) Institute for Statistics.
Catégories:
Education
Dernière mise à jour
23 avr. 2017
Les indicateurs de changement de valeurs selon les années
En moyenne:
85.999
Minimum:
67.581
1 janv. 2013
Maximum:
94.044
1 janv. 2008
Pour la date d''observation
Valeur
Changement absolu
Le changement par rapport à la valeur précédente
1 janv. 2000
91.128
+91.128
0.0%
1 janv. 2001
90.383
-0.745
-0.82%
1 janv. 2003
90.575
+0.192
0.21%
1 janv. 2004
90.554
-0.021
-0.02%
1 janv. 2005
90.53
-0.024
-0.03%
1 janv. 2006
90.773
+0.243
0.27%
1 janv. 2007
92.181
+1.408
1.55%
1 janv. 2008
94.044
+1.863
2.02%
1 janv. 2010
84.186
-9.858
-10.48%
1 janv. 2011
79.338
-4.848
-5.76%
1 janv. 2012
77.563
-1.775
-2.24%
1 janv. 2013
67.581
-9.982
-12.87%
1 janv. 2014
79.147
+11.566
17.11%
Classement des pays selon les statistiques actuelles par années

Commentaires:

Envoyer
PremiumAbout & FeedbackUn accordConfidentialité
logo
© 2022 Selected Technologies LLC – Morgan Hill, California