29
/fr/
fr
AIzaSyAYiBZKx7MnpbEhh9jyipgxe19OcubqV5w
April 1, 2024
55789
Pre-demographic dividend
PRE
false
2
1
Percentage of teachers in primary education who are trained, both sexes (%)
2015,2014,2013,2012,2011,2010,2009,2008,2007,2006,2005,2004,2003,2002
Download
Bibliothèque de statistiques globales →Pre-demographic dividend →

Percentage of teachers in primary education who are trained, both sexes (%)

Cette statistique dans les autres pays:
AlgeriaAndorraAngolaAntigua and BarbudaArab WorldArmeniaArubaAzerbaijanBahamas, TheBahrainBangladeshBarbadosBelarusBelizeBeninBermudaBhutanBoliviaBotswanaBritish Virgin IslandsBrunei DarussalamBurkina FasoBurundiCabo VerdeCambodiaCameroonCaribbean small statesCayman IslandsCentral African RepublicChadColombiaComorosCongo, Dem. Rep.Congo, Rep.Costa RicaCote d'IvoireCroatiaCubaDjiboutiDominicaDominican RepublicEarly-demographic dividendEcuadorEgypt, Arab Rep.El SalvadorEquatorial GuineaEritreaEthiopiaEurope & Central Asia (excluding high income)FijiFragile and conflict affected situationsGabonGambia, TheGeorgiaGhanaGibraltarGrenadaGuineaGuinea-BissauGuyanaHeavily indebted poor countries (HIPC)HondurasHong Kong SAR, ChinaIDA blendIDA onlyIDA totalIran, Islamic Rep.IraqJamaicaKazakhstanKenyaKiribatiKuwaitKyrgyz RepublicLao PDRLatin America & Caribbean Latin America & Caribbean (excluding high income)Latin America & the Caribbean (IDA & IBRD countries)Least developed countries: UN classificationLebanonLesothoLiberiaLow incomeLower middle incomeMacao SAR, ChinaMadagascarMalawiMalaysiaMaldivesMaliMauritaniaMauritiusMexicoMiddle East & North AfricaMiddle East & North Africa (excluding high income)Middle East & North Africa (IDA & IBRD countries)MoldovaMongoliaMoroccoMozambiqueMyanmarNamibiaNauruNepalNicaraguaNigerNigeriaOmanOther small statesPacific island small statesPakistanPanamaParaguayPhilippinesPre-demographic dividendQatarRwandaSao Tome and PrincipeSaudi ArabiaSenegalSerbiaSeychellesSierra LeoneSingaporeSmall statesSolomon IslandsSouth AfricaSouth SudanSri LankaSt. Kitts and NevisSt. LuciaSt. Vincent and the GrenadinesSub-Saharan Africa Sub-Saharan Africa (excluding high income)Sub-Saharan Africa (IDA & IBRD countries)SurinameSwazilandSyrian Arab RepublicTajikistanTanzaniaThailandTogoTongaTrinidad and TobagoTunisiaTurks and Caicos IslandsUgandaUkraineUnited Arab EmiratesUzbekistanVanuatuVietnamWest Bank and GazaZambiaZimbabwe
La ligne de temps
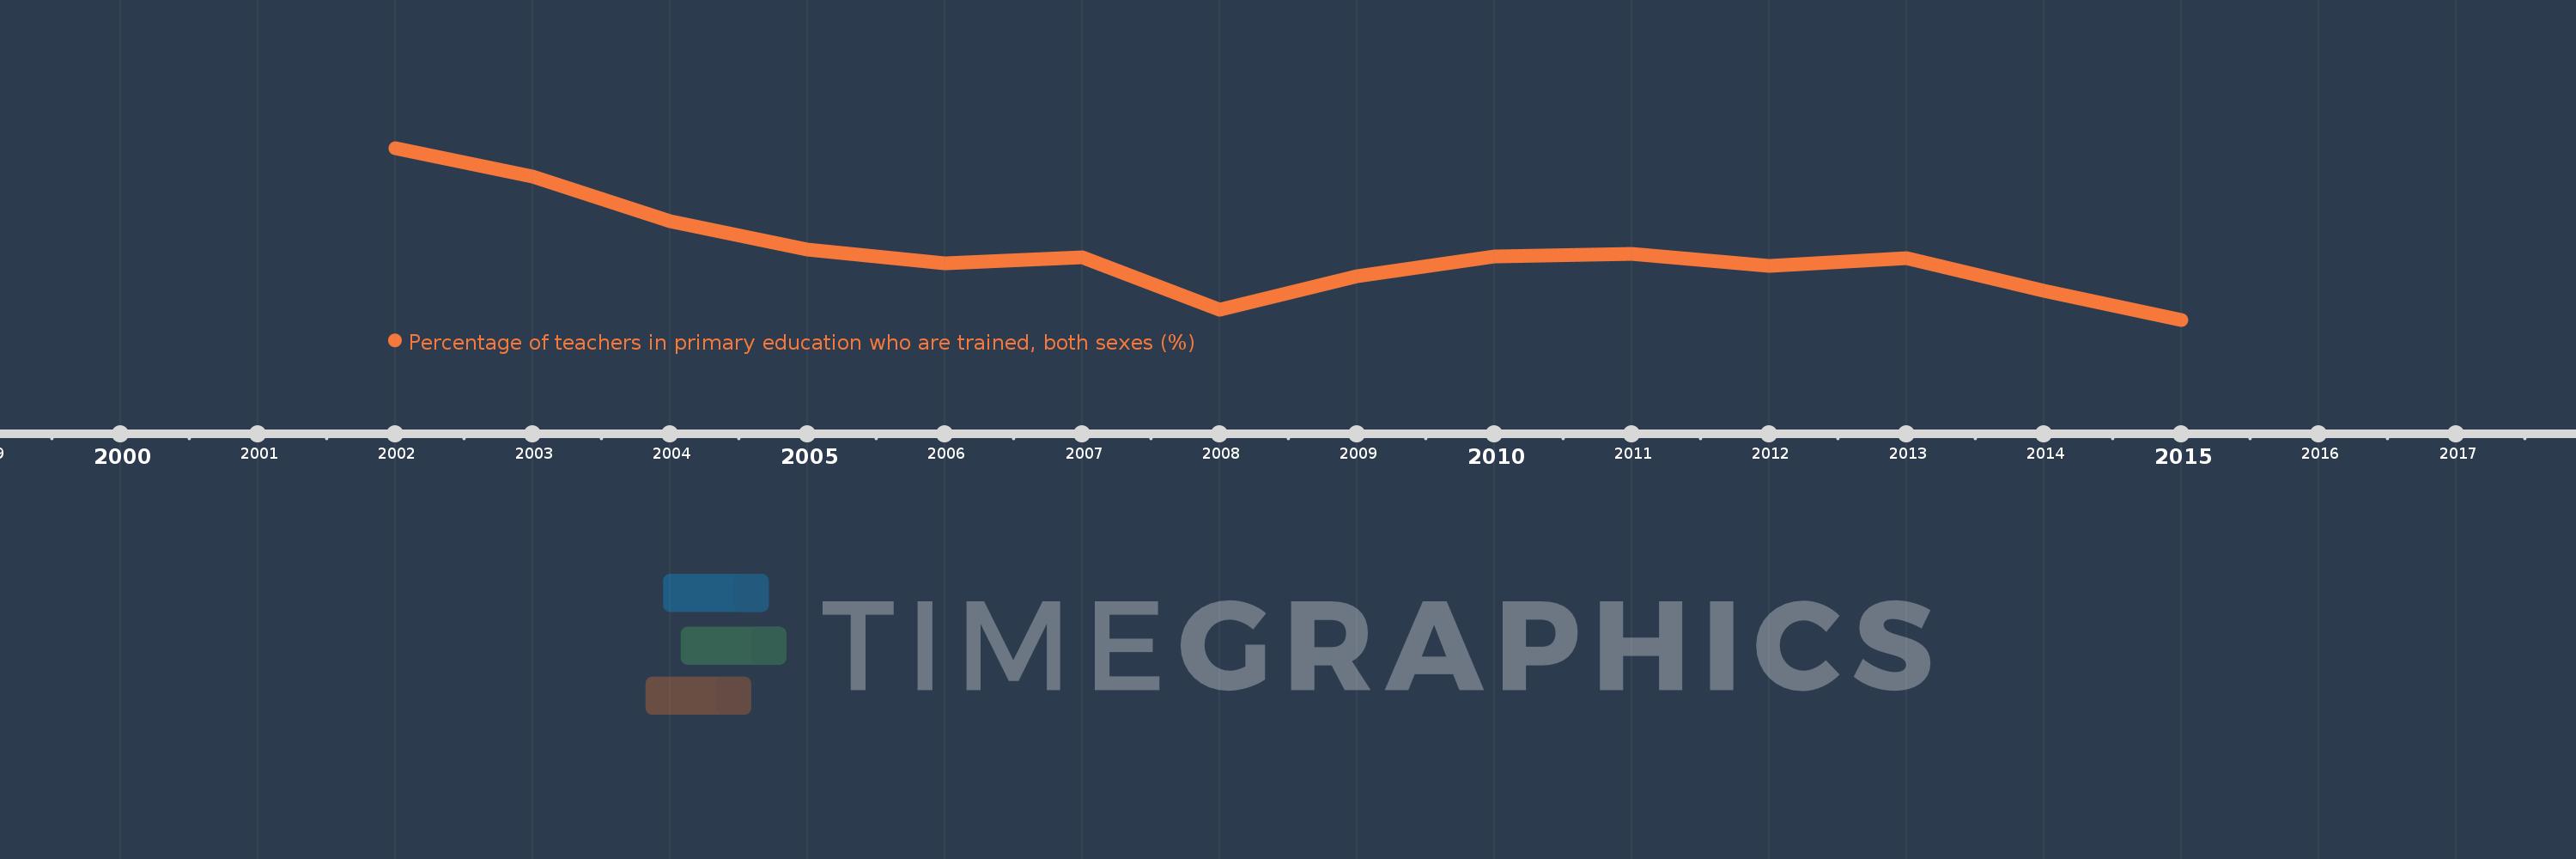
Cette échelle de temps montre un graphique de 2002 année à 2015 année Pre-demographic dividend. Les données jusqu'à 2001 année ne sont pas présentés. Quantité d'observations actuelles selon dates: 14.
Source (désignation):
Les indicateurs du développement mondiale
Source (organisation):
United Nations Educational, Scientific, and Cultural Organization (UNESCO) Institute for Statistics.
Catégories:
Education
Dernière mise à jour
23 avr. 2017
Les indicateurs de changement de valeurs selon les années
En moyenne:
76.1
Minimum:
72.772
1 janv. 2015
Maximum:
81.382
1 janv. 2002
Pour la date d''observation
Valeur
Changement absolu
Le changement par rapport à la valeur précédente
1 janv. 2002
81.382
+81.382
0.0%
1 janv. 2003
79.944
-1.438
-1.77%
1 janv. 2004
77.72
-2.224
-2.78%
1 janv. 2005
76.3
-1.42
-1.83%
1 janv. 2006
75.621
-0.679
-0.89%
1 janv. 2007
75.916
+0.295
0.39%
1 janv. 2008
73.261
-2.655
-3.5%
1 janv. 2009
74.96
+1.699
2.32%
1 janv. 2010
75.927
+0.967
1.29%
1 janv. 2011
76.072
+0.145
0.19%
1 janv. 2012
75.457
-0.615
-0.81%
1 janv. 2013
75.839
+0.381
0.51%
1 janv. 2014
74.228
-1.611
-2.12%
1 janv. 2015
72.772
-1.455
-1.96%
Classement des pays selon les statistiques actuelles par années

Commentaires:

Envoyer
PremiumAbout & FeedbackUn accordConfidentialité
logo
© 2022 Selected Technologies LLC – Morgan Hill, California