29
/fr/
fr
AIzaSyAYiBZKx7MnpbEhh9jyipgxe19OcubqV5w
April 1, 2024
283689
West Bank and Gaza
PSE
true
2
1
Gross savings (current US$)
2015,2014,2013,2012,2011,2010,2009,2008,2007,2006,2005,2004,2003,2002,2001,2000,1999,1998,1997,1996
Download
Bibliothèque de statistiques globales →West Bank and Gaza →

Gross savings (current US$)

Cette statistique dans les autres pays:
AfghanistanAlbaniaAlgeriaAngolaAntigua and BarbudaArgentinaArmeniaAustraliaAustriaAzerbaijanBahamas, TheBahrainBangladeshBarbadosBelarusBelgiumBelizeBeninBermudaBhutanBoliviaBosnia and HerzegovinaBotswanaBrazilBrunei DarussalamBulgariaBurkina FasoBurundiCabo VerdeCambodiaCameroonCanadaCentral African RepublicChadChileChinaColombiaComorosCongo, Dem. Rep.Congo, Rep.Costa RicaCote d'IvoireCroatiaCyprusCzech RepublicDenmarkDjiboutiDominicaDominican RepublicEcuadorEgypt, Arab Rep.El SalvadorEquatorial GuineaEritreaEstoniaEthiopiaFaroe IslandsFijiFinlandFranceGabonGambia, TheGeorgiaGermanyGhanaGreeceGrenadaGuatemalaGuineaGuinea-BissauGuyanaHaitiHondurasHong Kong SAR, ChinaHungaryIcelandIndiaIndonesiaIran, Islamic Rep.IraqIrelandIsraelItalyJamaicaJapanJordanKazakhstanKenyaKiribatiKorea, Rep.KosovoKuwaitKyrgyz RepublicLao PDRLatviaLebanonLesothoLiberiaLibyaLithuaniaLuxembourgMacao SAR, ChinaMacedonia, FYRMadagascarMalawiMalaysiaMaldivesMaliMaltaMauritaniaMauritiusMexicoMoldovaMongoliaMontenegroMoroccoMozambiqueNamibiaNepalNetherlandsNew ZealandNicaraguaNigerNigeriaNorwayOmanPakistanPanamaPapua New GuineaParaguayPeruPhilippinesPolandPortugalQatarRomaniaRussian FederationRwandaSaudi ArabiaSenegalSerbiaSeychellesSierra LeoneSingaporeSlovak RepublicSloveniaSolomon IslandsSouth AfricaSouth SudanSpainSri LankaSt. Kitts and NevisSt. LuciaSt. Vincent and the GrenadinesSudanSurinameSwazilandSwedenSwitzerlandSyrian Arab RepublicTajikistanTanzaniaThailandTimor-LesteTogoTongaTrinidad and TobagoTunisiaTurkeyUgandaUkraineUnited KingdomUnited StatesUruguayVanuatuVenezuela, RBVietnamWest Bank and GazaYemen, Rep.ZambiaZimbabwe
La ligne de temps
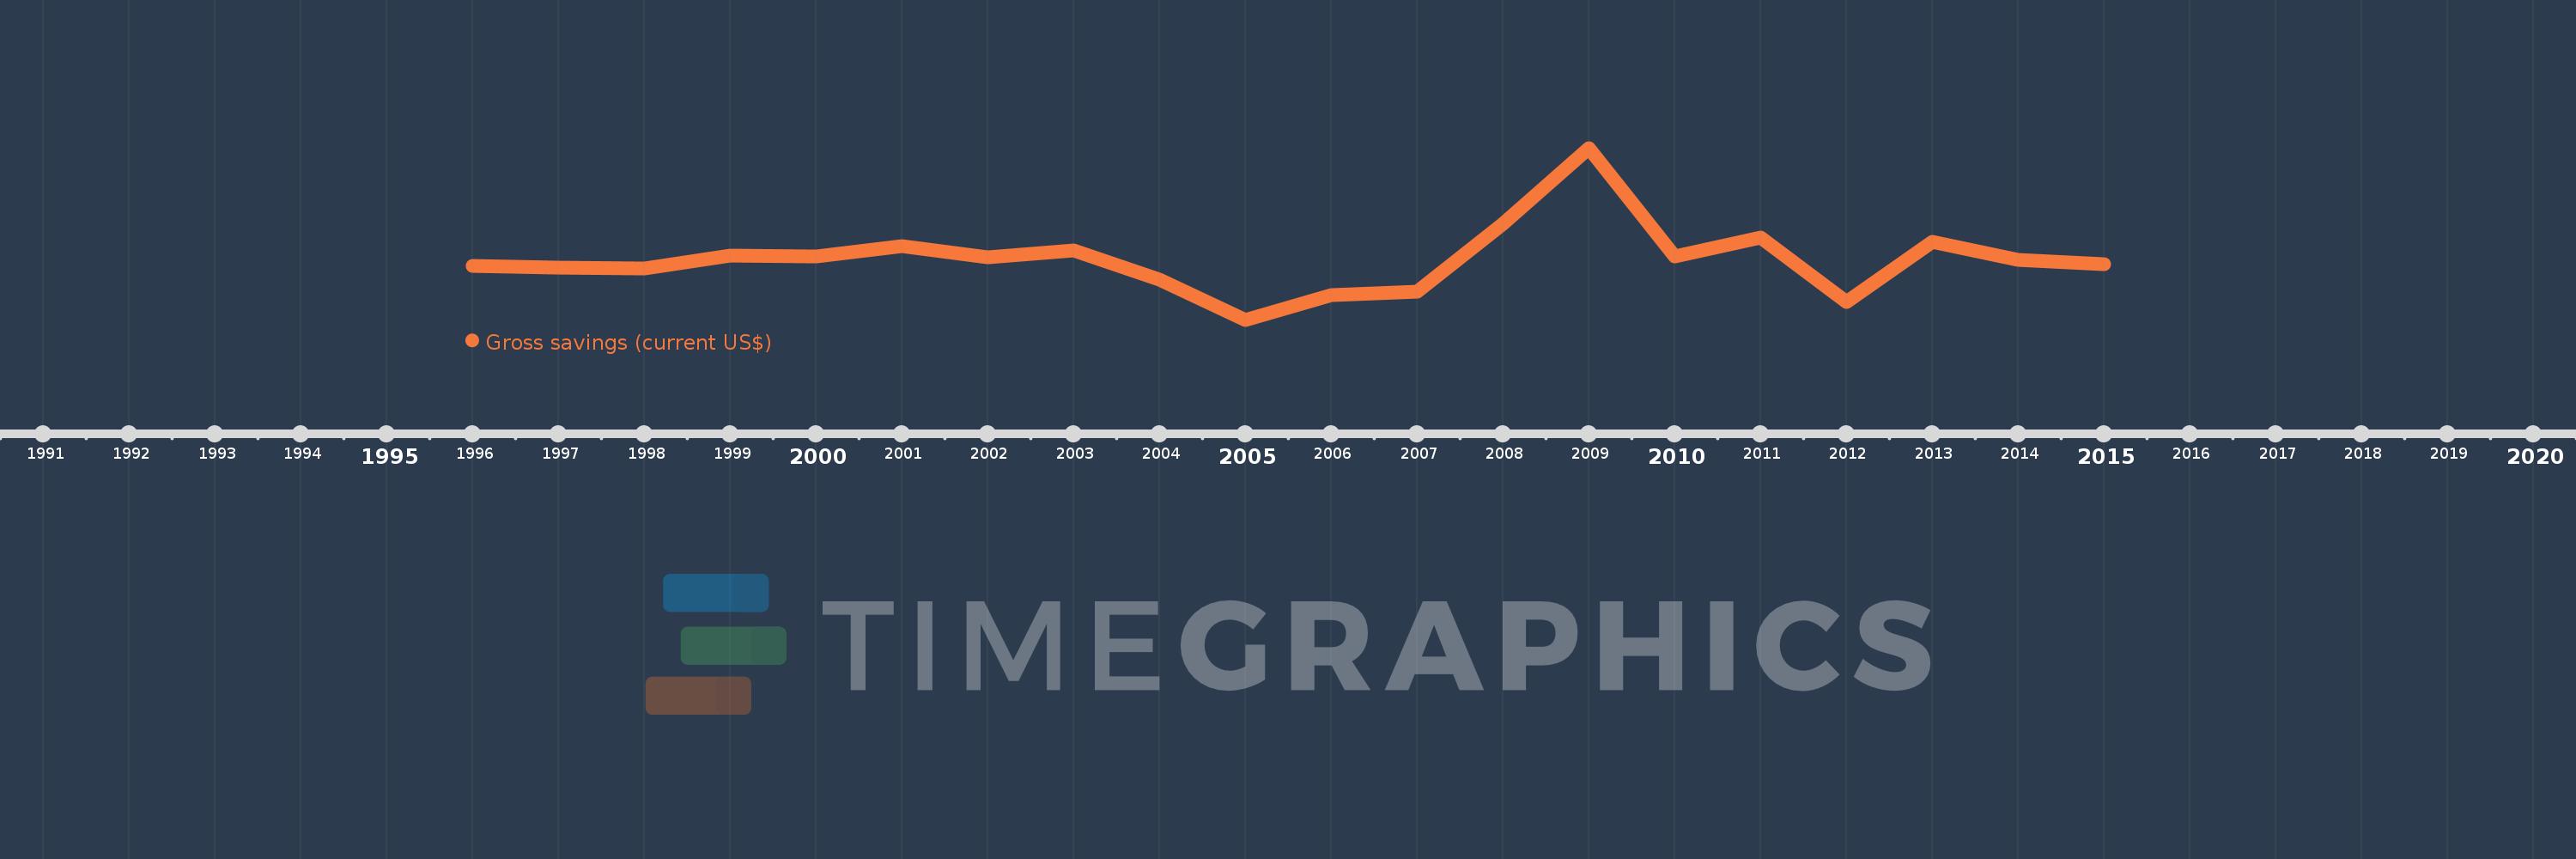
Cette échelle de temps montre un graphique de 1996 année à 2015 année West Bank and Gaza. Les données jusqu'à 1995 année ne sont pas présentés. Quantité d'observations actuelles selon dates: 20.
Source (désignation):
Les indicateurs du développement mondiale
Source (organisation):
World Bank national accounts data, and OECD National Accounts data files.
Catégories:
Economy & Growth
Dernière mise à jour
23 avr. 2017
Les indicateurs de changement de valeurs selon les années
En moyenne:
331.701 mln.
Minimum:
-436.305 mln.
1 janv. 2005
Maximum:
1.752 mds
1 janv. 2009
Pour la date d''observation
Valeur
Changement absolu
Le changement par rapport à la valeur précédente
1 janv. 1996
245.1 mln.
+245.1 mln.
0.0%
1 janv. 1997
224.1 mln.
-21.0 mln.
-8.57%
1 janv. 1998
211.6 mln.
-12.5 mln.
-5.58%
1 janv. 1999
379.743 mln.
+168.143 mln.
79.46%
1 janv. 2000
371.823 mln.
-7.92 mln.
-2.09%
1 janv. 2001
502.236 mln.
+130.413 mln.
35.07%
1 janv. 2002
356.373 mln.
-145.862 mln.
-29.04%
1 janv. 2003
444.924 mln.
+88.551 mln.
24.85%
1 janv. 2004
72.543 mln.
-372.381 mln.
-83.7%
1 janv. 2005
-436.305 mln.
-508.849 mln.
-701.44%
1 janv. 2006
-123.921 mln.
+312.384 mln.
-71.6%
1 janv. 2007
-78.467 mln.
+45.454 mln.
-36.68%
1 janv. 2008
786.383 mln.
+864.85 mln.
-1.1 milles%
1 janv. 2009
1.752 mds
+966.047 mln.
122.85%
1 janv. 2010
367.914 mln.
-1.385 mds
-79.01%
1 janv. 2011
614.573 mln.
+246.658 mln.
67.04%
1 janv. 2012
-205.075 mln.
-819.648 mln.
-133.37%
1 janv. 2013
557.666 mln.
+762.741 mln.
-371.93%
1 janv. 2014
324.044 mln.
-233.622 mln.
-41.89%
1 janv. 2015
266.329 mln.
-57.715 mln.
-17.81%
Classement des pays selon les statistiques actuelles par années

Commentaires:

Envoyer
PremiumAbout & FeedbackUn accordConfidentialité
logo
© 2022 Selected Technologies LLC – Morgan Hill, California