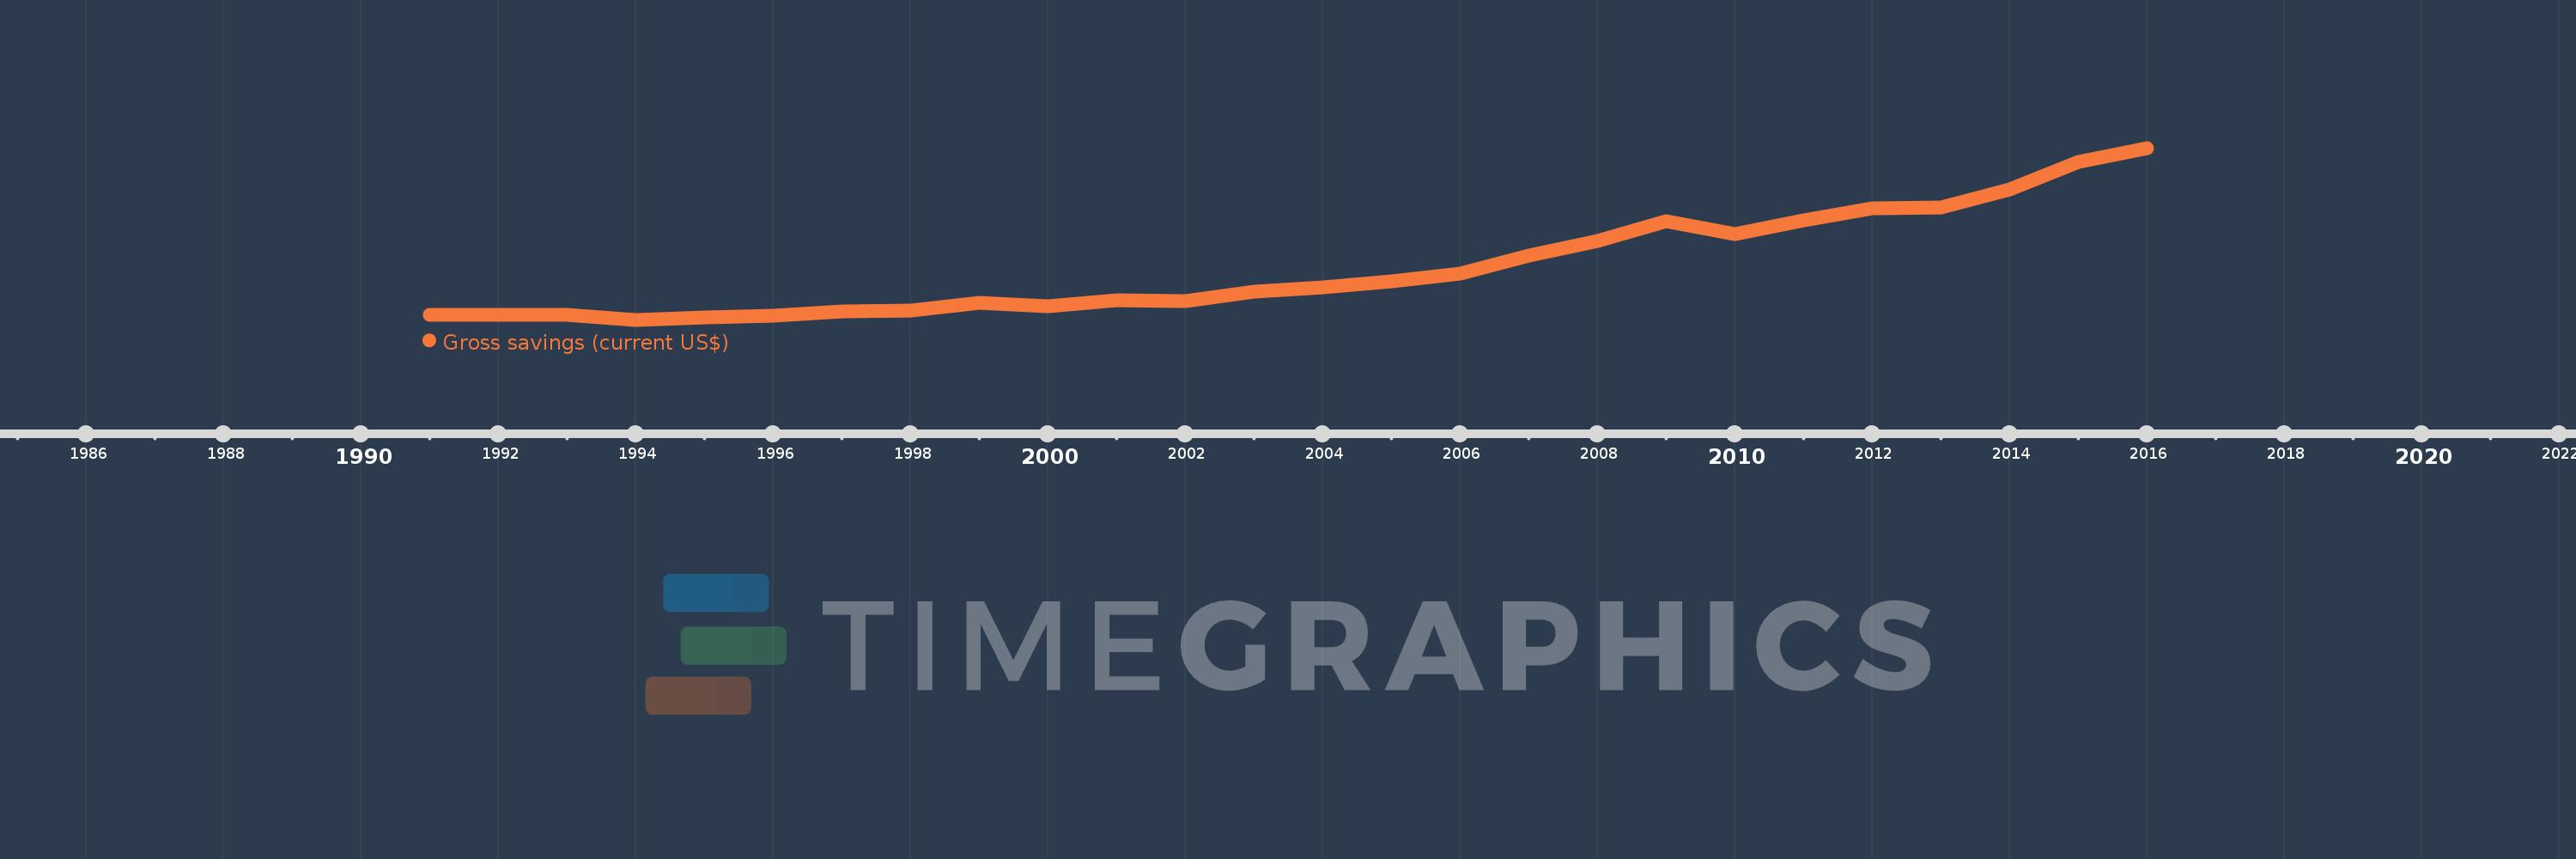
Cette échelle de temps montre un graphique de 1991 année à 2016 année Tanzania. Les données jusqu'à 1990 année ne sont pas présentés. Quantité d'observations actuelles selon dates: 26.
Source (désignation):
Les indicateurs du développement mondiale
Source (organisation):
World Bank national accounts data, and OECD National Accounts data files.
Catégories:
Economy & Growth
Dernière mise à jour
23 avr. 2017
Les indicateurs de changement de valeurs selon les années
En moyenne:
3.245 mds
Minimum:
152.473 mln.
1 janv. 1994
Maximum:
10.288 mds
1 janv. 2016
Pour la date d''observation
Valeur
Changement absolu
Le changement par rapport à la valeur précédente
1 janv. 1991
429.753 mln.
+429.753 mln.
0.0%
1 janv. 1992
432.969 mln.
+3.216 mln.
0.75%
1 janv. 1993
442.245 mln.
+9.276 mln.
2.14%
1 janv. 1994
152.473 mln.
-289.771 mln.
-65.52%
1 janv. 1995
280.185 mln.
+127.711 mln.
83.76%
1 janv. 1996
389.107 mln.
+108.922 mln.
38.88%
1 janv. 1997
665.54 mln.
+276.433 mln.
71.04%
1 janv. 1998
697.806 mln.
+32.266 mln.
4.85%
1 janv. 1999
1.154 mds
+456.367 mln.
65.4%
1 janv. 2000
941.271 mln.
-212.902 mln.
-18.45%
1 janv. 2001
1.285 mds
+343.563 mln.
36.5%
1 janv. 2002
1.247 mds
-38.013 mln.
-2.96%
1 janv. 2003
1.812 mds
+564.88 mln.
45.31%
1 janv. 2004
2.056 mds
+243.999 mln.
13.47%
1 janv. 2005
2.431 mds
+375.255 mln.
18.25%
1 janv. 2006
2.886 mds
+455.44 mln.
18.74%
1 janv. 2007
3.941 mds
+1.054 mds
36.53%
1 janv. 2008
4.776 mds
+834.996 mln.
21.19%
1 janv. 2009
5.976 mds
+1.2 mds
25.13%
1 janv. 2010
5.228 mds
-747.42 mln.
-12.51%
1 janv. 2011
6.033 mds
+804.528 mln.
15.39%
1 janv. 2012
6.727 mds
+693.669 mln.
11.5%
1 janv. 2013
6.752 mds
+25.757 mln.
0.38%
1 janv. 2014
7.86 mds
+1.107 mds
16.4%
1 janv. 2015
9.481 mds
+1.621 mds
20.62%
1 janv. 2016
10.288 mds
+806.873 mln.
8.51%
Classement des pays selon les statistiques actuelles par années