33
/fr/
AIzaSyAYiBZKx7MnpbEhh9jyipgxe19OcubqV5w
August 1, 2025
193100
Mauritania
MRT
true
2
1
Gross savings (current US$)
2015,2014,2013,1999,1998,1997,1996,1995,1994,1993,1992,1991,1990,1989,1988,1987,1986,1985,1984,1983,1982,1981,1980,1979,1978,1977,1976
Download
Bibliothèque de statistiques globales →Mauritania →

Gross savings (current US$)

Cette statistique dans les autres pays:

AfghanistanAlbaniaAlgeriaAngolaAntigua and BarbudaArgentinaArmeniaAustraliaAustriaAzerbaijanBahamas, TheBahrainBangladeshBarbadosBelarusBelgiumBelizeBeninBermudaBhutanBoliviaBosnia and HerzegovinaBotswanaBrazilBrunei DarussalamBulgariaBurkina FasoBurundiCabo VerdeCambodiaCameroonCanadaCentral African RepublicChadChileChinaColombiaComorosCongo, Dem. Rep.Congo, Rep.Costa RicaCote d'IvoireCroatiaCyprusCzech RepublicDenmarkDjiboutiDominicaDominican RepublicEcuadorEgypt, Arab Rep.El SalvadorEquatorial GuineaEritreaEstoniaEthiopiaFaroe IslandsFijiFinlandFranceGabonGambia, TheGeorgiaGermanyGhanaGreeceGrenadaGuatemalaGuineaGuinea-BissauGuyanaHaitiHondurasHong Kong SAR, ChinaHungaryIcelandIndiaIndonesiaIran, Islamic Rep.IraqIrelandIsraelItalyJamaicaJapanJordanKazakhstanKenyaKiribatiKorea, Rep.KosovoKuwaitKyrgyz RepublicLao PDRLatviaLebanonLesothoLiberiaLibyaLithuaniaLuxembourgMacao SAR, ChinaMacedonia, FYRMadagascarMalawiMalaysiaMaldivesMaliMaltaMauritaniaMauritiusMexicoMoldovaMongoliaMontenegroMoroccoMozambiqueNamibiaNepalNetherlandsNew ZealandNicaraguaNigerNigeriaNorwayOmanPakistanPanamaPapua New GuineaParaguayPeruPhilippinesPolandPortugalQatarRomaniaRussian FederationRwandaSaudi ArabiaSenegalSerbiaSeychellesSierra LeoneSingaporeSlovak RepublicSloveniaSolomon IslandsSouth AfricaSouth SudanSpainSri LankaSt. Kitts and NevisSt. LuciaSt. Vincent and the GrenadinesSudanSurinameSwazilandSwedenSwitzerlandSyrian Arab RepublicTajikistanTanzaniaThailandTimor-LesteTogoTongaTrinidad and TobagoTunisiaTurkeyUgandaUkraineUnited KingdomUnited StatesUruguayVanuatuVenezuela, RBVietnamWest Bank and GazaYemen, Rep.ZambiaZimbabwe

La ligne de temps

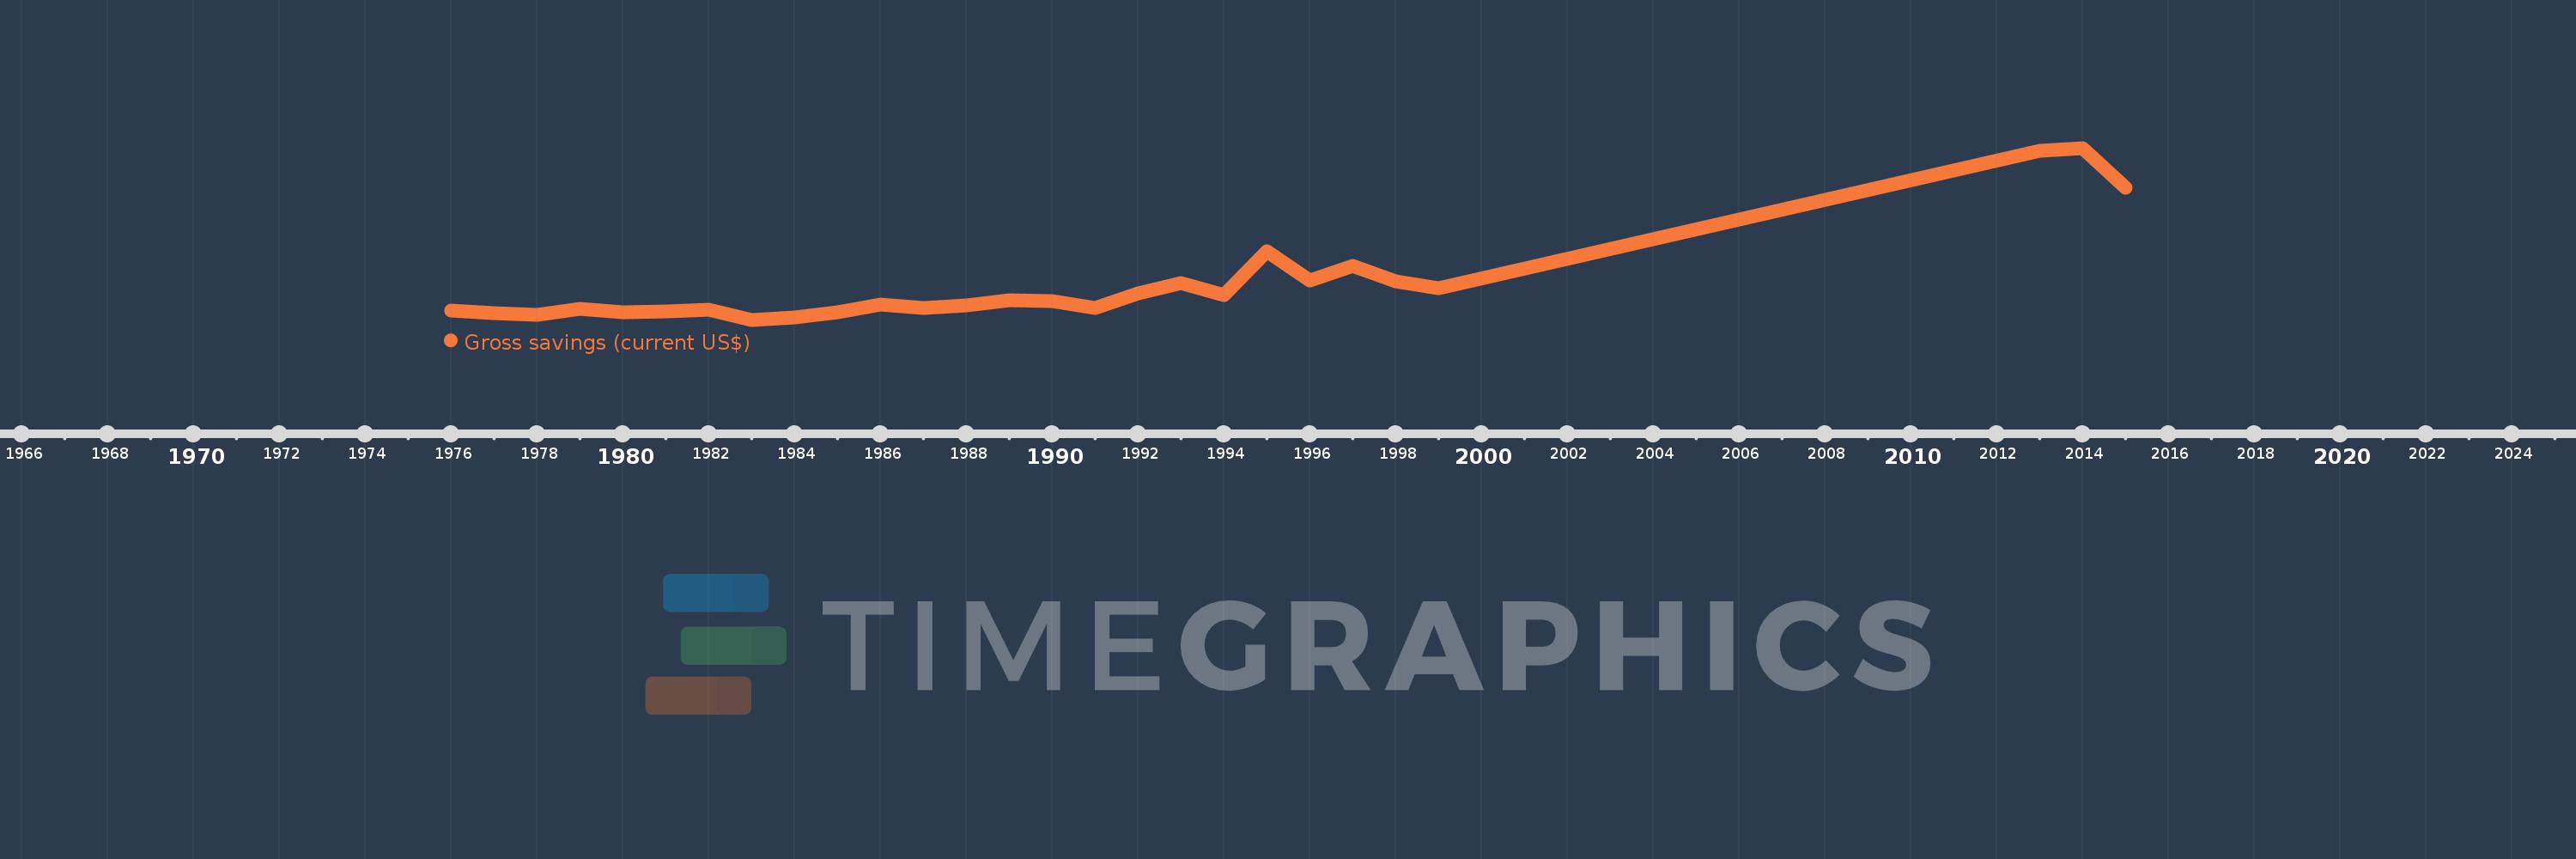
Cette échelle de temps montre un graphique de 1976 année à 2015 année Mauritania. Les données jusqu'à 1975 année ne sont pas présentés. Quantité d'observations actuelles selon dates: 27.

Source (désignation):

Les indicateurs du développement mondiale

Source (organisation):

World Bank national accounts data, and OECD National Accounts data files.

Catégories:

Economy & Growth

Dernière mise à jour

23 avr. 2017

Les indicateurs de changement de valeurs selon les années

En moyenne:
332.886 mln.
Minimum:
-57.946 mln.
1 janv. 1983
Maximum:
1.846 mds
1 janv. 2014
Pour la date d''observation
Valeur
Changement absolu
Le changement par rapport à la valeur précédente
1 janv. 1976
43.734 mln.
+43.734 mln.
0.0%
1 janv. 1977
17.523 mln.
-26.211 mln.
-59.93%
1 janv. 1978
-5.385 mln.
-22.907 mln.
-130.73%
1 janv. 1979
62.763 mln.
+68.148 mln.
-1.27 milles%
1 janv. 1980
27.591 mln.
-35.172 mln.
-56.04%
1 janv. 1981
37.923 mln.
+10.331 mln.
37.44%
1 janv. 1982
52.34 mln.
+14.417 mln.
38.02%
1 janv. 1983
-57.946 mln.
-110.286 mln.
-210.71%
1 janv. 1984
-36.113 mln.
+21.833 mln.
-37.68%
1 janv. 1985
24.821 mln.
+60.934 mln.
-168.73%
1 janv. 1986
110.608 mln.
+85.787 mln.
345.63%
1 janv. 1987
74.745 mln.
-35.863 mln.
-32.42%
1 janv. 1988
99.564 mln.
+24.819 mln.
33.21%
1 janv. 1989
156.626 mln.
+57.062 mln.
57.31%
1 janv. 1990
149.691 mln.
-6.936 mln.
-4.43%
1 janv. 1991
76.572 mln.
-73.118 mln.
-48.85%
1 janv. 1992
237.715 mln.
+161.143 mln.
210.44%
1 janv. 1993
350.257 mln.
+112.542 mln.
47.34%
1 janv. 1994
219.132 mln.
-131.126 mln.
-37.44%
1 janv. 1995
698.645 mln.
+479.513 mln.
218.82%
1 janv. 1996
376.052 mln.
-322.593 mln.
-46.17%
1 janv. 1997
539.607 mln.
+163.555 mln.
43.49%
1 janv. 1998
368.389 mln.
-171.218 mln.
-31.73%
1 janv. 1999
293.566 mln.
-74.823 mln.
-20.31%
1 janv. 2013
1.814 mds
+1.521 mds
518.01%
1 janv. 2014
1.846 mds
+31.882 mln.
1.76%
1 janv. 2015
1.409 mds
-437.089 mln.
-23.68%

Classement des pays selon les statistiques actuelles par années