33
/fr/
AIzaSyAYiBZKx7MnpbEhh9jyipgxe19OcubqV5w
May 1, 2025
255254
Swaziland
SWZ
true
2
1
Gross savings (current US$)
2015,2014,2013,2012,2011,2010,2009,2008,2007,2006,2005,2004,2003,2002,2001,2000,1999,1998,1997,1996,1995,1994,1993,1992,1991,1975
Download
Bibliothèque de statistiques globales →Swaziland →

Gross savings (current US$)

Cette statistique dans les autres pays:

AfghanistanAlbaniaAlgeriaAngolaAntigua and BarbudaArgentinaArmeniaAustraliaAustriaAzerbaijanBahamas, TheBahrainBangladeshBarbadosBelarusBelgiumBelizeBeninBermudaBhutanBoliviaBosnia and HerzegovinaBotswanaBrazilBrunei DarussalamBulgariaBurkina FasoBurundiCabo VerdeCambodiaCameroonCanadaCentral African RepublicChadChileChinaColombiaComorosCongo, Dem. Rep.Congo, Rep.Costa RicaCote d'IvoireCroatiaCyprusCzech RepublicDenmarkDjiboutiDominicaDominican RepublicEcuadorEgypt, Arab Rep.El SalvadorEquatorial GuineaEritreaEstoniaEthiopiaFaroe IslandsFijiFinlandFranceGabonGambia, TheGeorgiaGermanyGhanaGreeceGrenadaGuatemalaGuineaGuinea-BissauGuyanaHaitiHondurasHong Kong SAR, ChinaHungaryIcelandIndiaIndonesiaIran, Islamic Rep.IraqIrelandIsraelItalyJamaicaJapanJordanKazakhstanKenyaKiribatiKorea, Rep.KosovoKuwaitKyrgyz RepublicLao PDRLatviaLebanonLesothoLiberiaLibyaLithuaniaLuxembourgMacao SAR, ChinaMacedonia, FYRMadagascarMalawiMalaysiaMaldivesMaliMaltaMauritaniaMauritiusMexicoMoldovaMongoliaMontenegroMoroccoMozambiqueNamibiaNepalNetherlandsNew ZealandNicaraguaNigerNigeriaNorwayOmanPakistanPanamaPapua New GuineaParaguayPeruPhilippinesPolandPortugalQatarRomaniaRussian FederationRwandaSaudi ArabiaSenegalSerbiaSeychellesSierra LeoneSingaporeSlovak RepublicSloveniaSolomon IslandsSouth AfricaSouth SudanSpainSri LankaSt. Kitts and NevisSt. LuciaSt. Vincent and the GrenadinesSudanSurinameSwazilandSwedenSwitzerlandSyrian Arab RepublicTajikistanTanzaniaThailandTimor-LesteTogoTongaTrinidad and TobagoTunisiaTurkeyUgandaUkraineUnited KingdomUnited StatesUruguayVanuatuVenezuela, RBVietnamWest Bank and GazaYemen, Rep.ZambiaZimbabwe

La ligne de temps

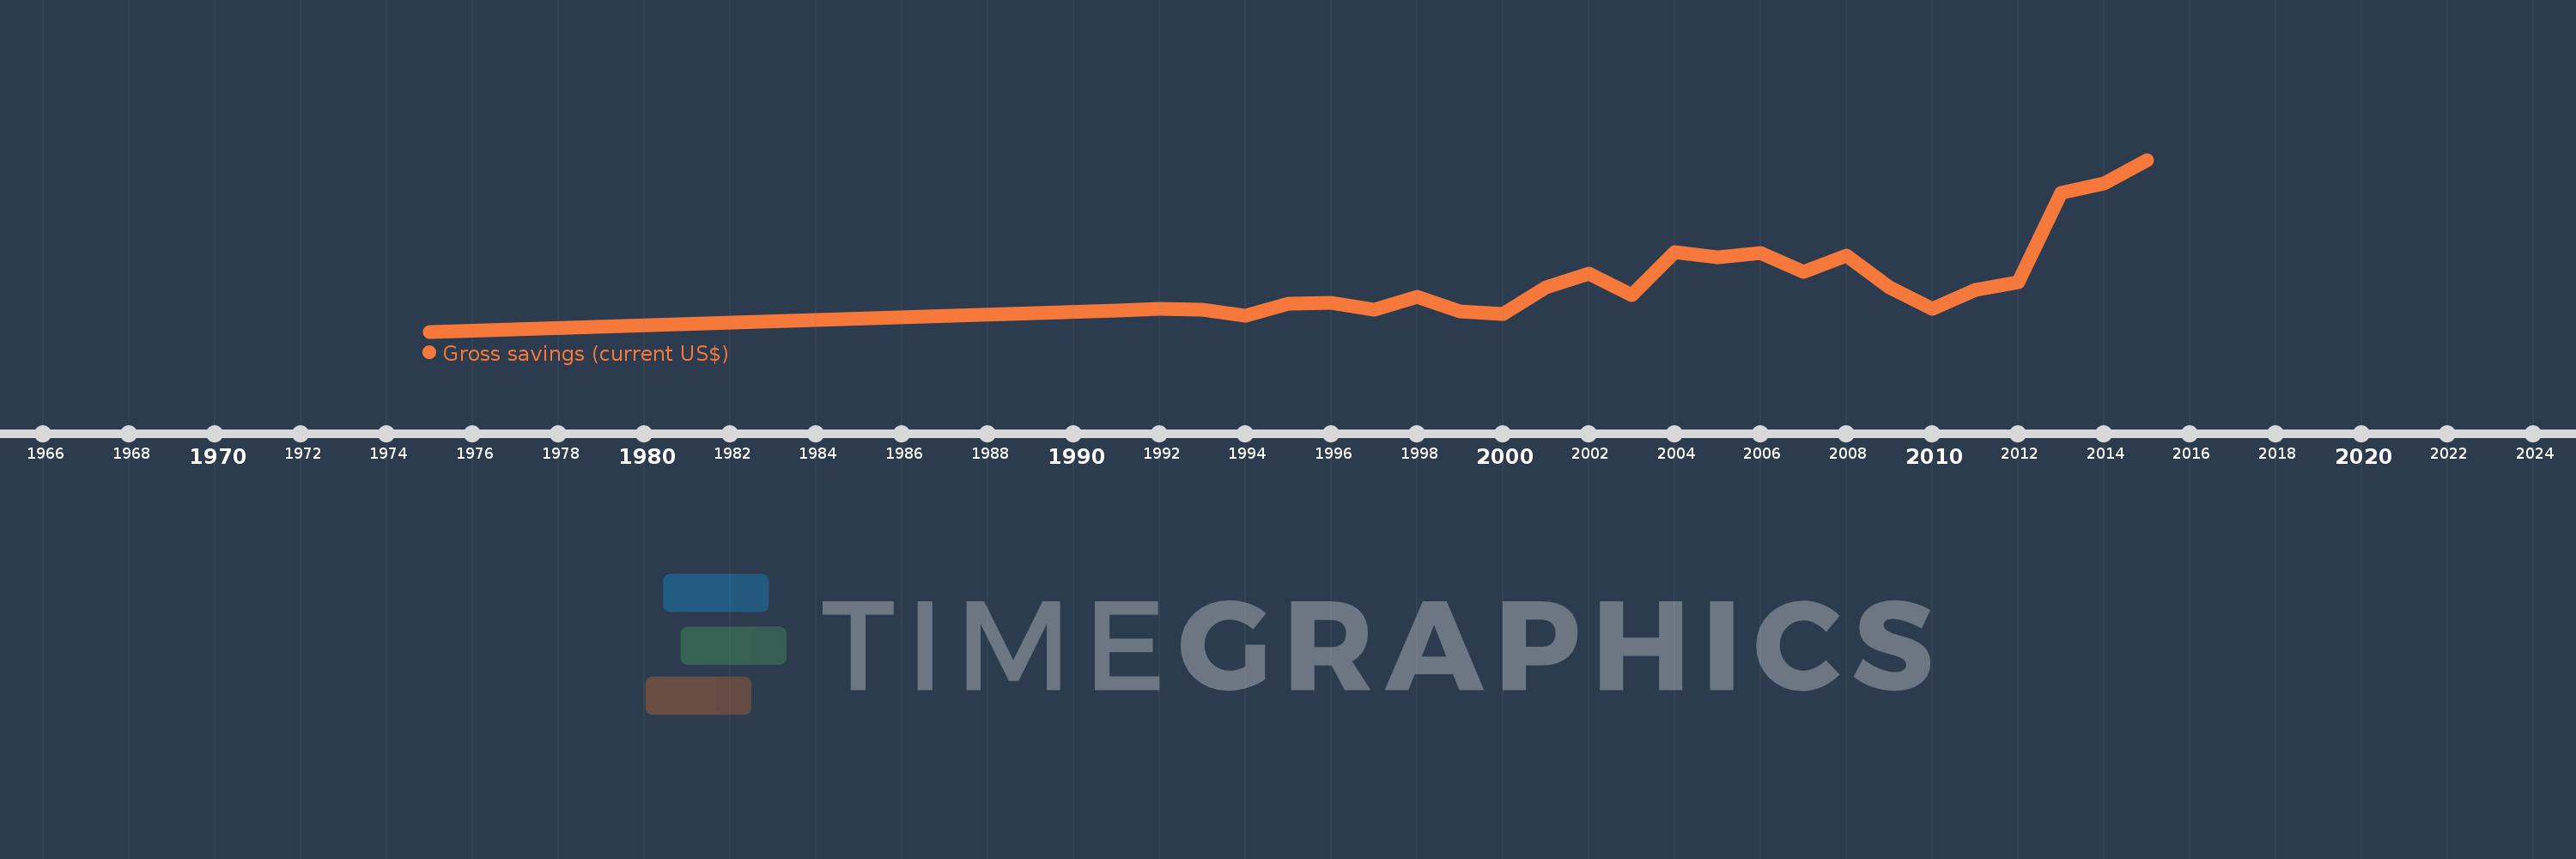
Cette échelle de temps montre un graphique de 1975 année à 2015 année Swaziland. Les données jusqu'à 1974 année ne sont pas présentés. Quantité d'observations actuelles selon dates: 26.

Source (désignation):

Les indicateurs du développement mondiale

Source (organisation):

World Bank national accounts data, and OECD National Accounts data files.

Catégories:

Economy & Growth

Dernière mise à jour

23 avr. 2017

Les indicateurs de changement de valeurs selon les années

En moyenne:
390.8 mln.
Minimum:
103.305 mln.
1 janv. 1975
Maximum:
1.049 mds
1 janv. 2015
Pour la date d''observation
Valeur
Changement absolu
Le changement par rapport à la valeur précédente
1 janv. 1975
103.305 mln.
+103.305 mln.
0.0%
1 janv. 1991
219.205 mln.
+115.9 mln.
112.19%
1 janv. 1992
228.075 mln.
+8.87 mln.
4.05%
1 janv. 1993
223.177 mln.
-4.898 mln.
-2.15%
1 janv. 1994
189.738 mln.
-33.439 mln.
-14.98%
1 janv. 1995
256.902 mln.
+67.165 mln.
35.4%
1 janv. 1996
263.426 mln.
+6.524 mln.
2.54%
1 janv. 1997
223.844 mln.
-39.581 mln.
-15.03%
1 janv. 1998
295.895 mln.
+72.051 mln.
32.19%
1 janv. 1999
213.036 mln.
-82.859 mln.
-28.0%
1 janv. 2000
201.417 mln.
-11.619 mln.
-5.45%
1 janv. 2001
345.987 mln.
+144.569 mln.
71.78%
1 janv. 2002
422.285 mln.
+76.298 mln.
22.05%
1 janv. 2003
306.571 mln.
-115.714 mln.
-27.4%
1 janv. 2004
541.941 mln.
+235.37 mln.
76.78%
1 janv. 2005
512.794 mln.
-29.147 mln.
-5.38%
1 janv. 2006
536.265 mln.
+23.471 mln.
4.58%
1 janv. 2007
434.115 mln.
-102.151 mln.
-19.05%
1 janv. 2008
521.248 mln.
+87.134 mln.
20.07%
1 janv. 2009
347.315 mln.
-173.933 mln.
-33.37%
1 janv. 2010
230.866 mln.
-116.449 mln.
-33.53%
1 janv. 2011
330.926 mln.
+100.06 mln.
43.34%
1 janv. 2012
373.277 mln.
+42.351 mln.
12.8%
1 janv. 2013
868.047 mln.
+494.771 mln.
132.55%
1 janv. 2014
921.674 mln.
+53.626 mln.
6.18%
1 janv. 2015
1.049 mds
+127.784 mln.
13.86%

Classement des pays selon les statistiques actuelles par années