33
/fr/
AIzaSyAYiBZKx7MnpbEhh9jyipgxe19OcubqV5w
August 1, 2025
108589
Comoros
COM
true
2
1
Gross savings (current US$)
2013,2012,2011,2010,2009,2008,2007,2006,2005,2004,1996,1995,1994,1993,1992,1991,1990,1989,1988,1987,1986,1985,1984,1983,1982,1981
Download
Bibliothèque de statistiques globales →Comoros →

Gross savings (current US$)

Cette statistique dans les autres pays:

AfghanistanAlbaniaAlgeriaAngolaAntigua and BarbudaArgentinaArmeniaAustraliaAustriaAzerbaijanBahamas, TheBahrainBangladeshBarbadosBelarusBelgiumBelizeBeninBermudaBhutanBoliviaBosnia and HerzegovinaBotswanaBrazilBrunei DarussalamBulgariaBurkina FasoBurundiCabo VerdeCambodiaCameroonCanadaCentral African RepublicChadChileChinaColombiaComorosCongo, Dem. Rep.Congo, Rep.Costa RicaCote d'IvoireCroatiaCyprusCzech RepublicDenmarkDjiboutiDominicaDominican RepublicEcuadorEgypt, Arab Rep.El SalvadorEquatorial GuineaEritreaEstoniaEthiopiaFaroe IslandsFijiFinlandFranceGabonGambia, TheGeorgiaGermanyGhanaGreeceGrenadaGuatemalaGuineaGuinea-BissauGuyanaHaitiHondurasHong Kong SAR, ChinaHungaryIcelandIndiaIndonesiaIran, Islamic Rep.IraqIrelandIsraelItalyJamaicaJapanJordanKazakhstanKenyaKiribatiKorea, Rep.KosovoKuwaitKyrgyz RepublicLao PDRLatviaLebanonLesothoLiberiaLibyaLithuaniaLuxembourgMacao SAR, ChinaMacedonia, FYRMadagascarMalawiMalaysiaMaldivesMaliMaltaMauritaniaMauritiusMexicoMoldovaMongoliaMontenegroMoroccoMozambiqueNamibiaNepalNetherlandsNew ZealandNicaraguaNigerNigeriaNorwayOmanPakistanPanamaPapua New GuineaParaguayPeruPhilippinesPolandPortugalQatarRomaniaRussian FederationRwandaSaudi ArabiaSenegalSerbiaSeychellesSierra LeoneSingaporeSlovak RepublicSloveniaSolomon IslandsSouth AfricaSouth SudanSpainSri LankaSt. Kitts and NevisSt. LuciaSt. Vincent and the GrenadinesSudanSurinameSwazilandSwedenSwitzerlandSyrian Arab RepublicTajikistanTanzaniaThailandTimor-LesteTogoTongaTrinidad and TobagoTunisiaTurkeyUgandaUkraineUnited KingdomUnited StatesUruguayVanuatuVenezuela, RBVietnamWest Bank and GazaYemen, Rep.ZambiaZimbabwe

La ligne de temps

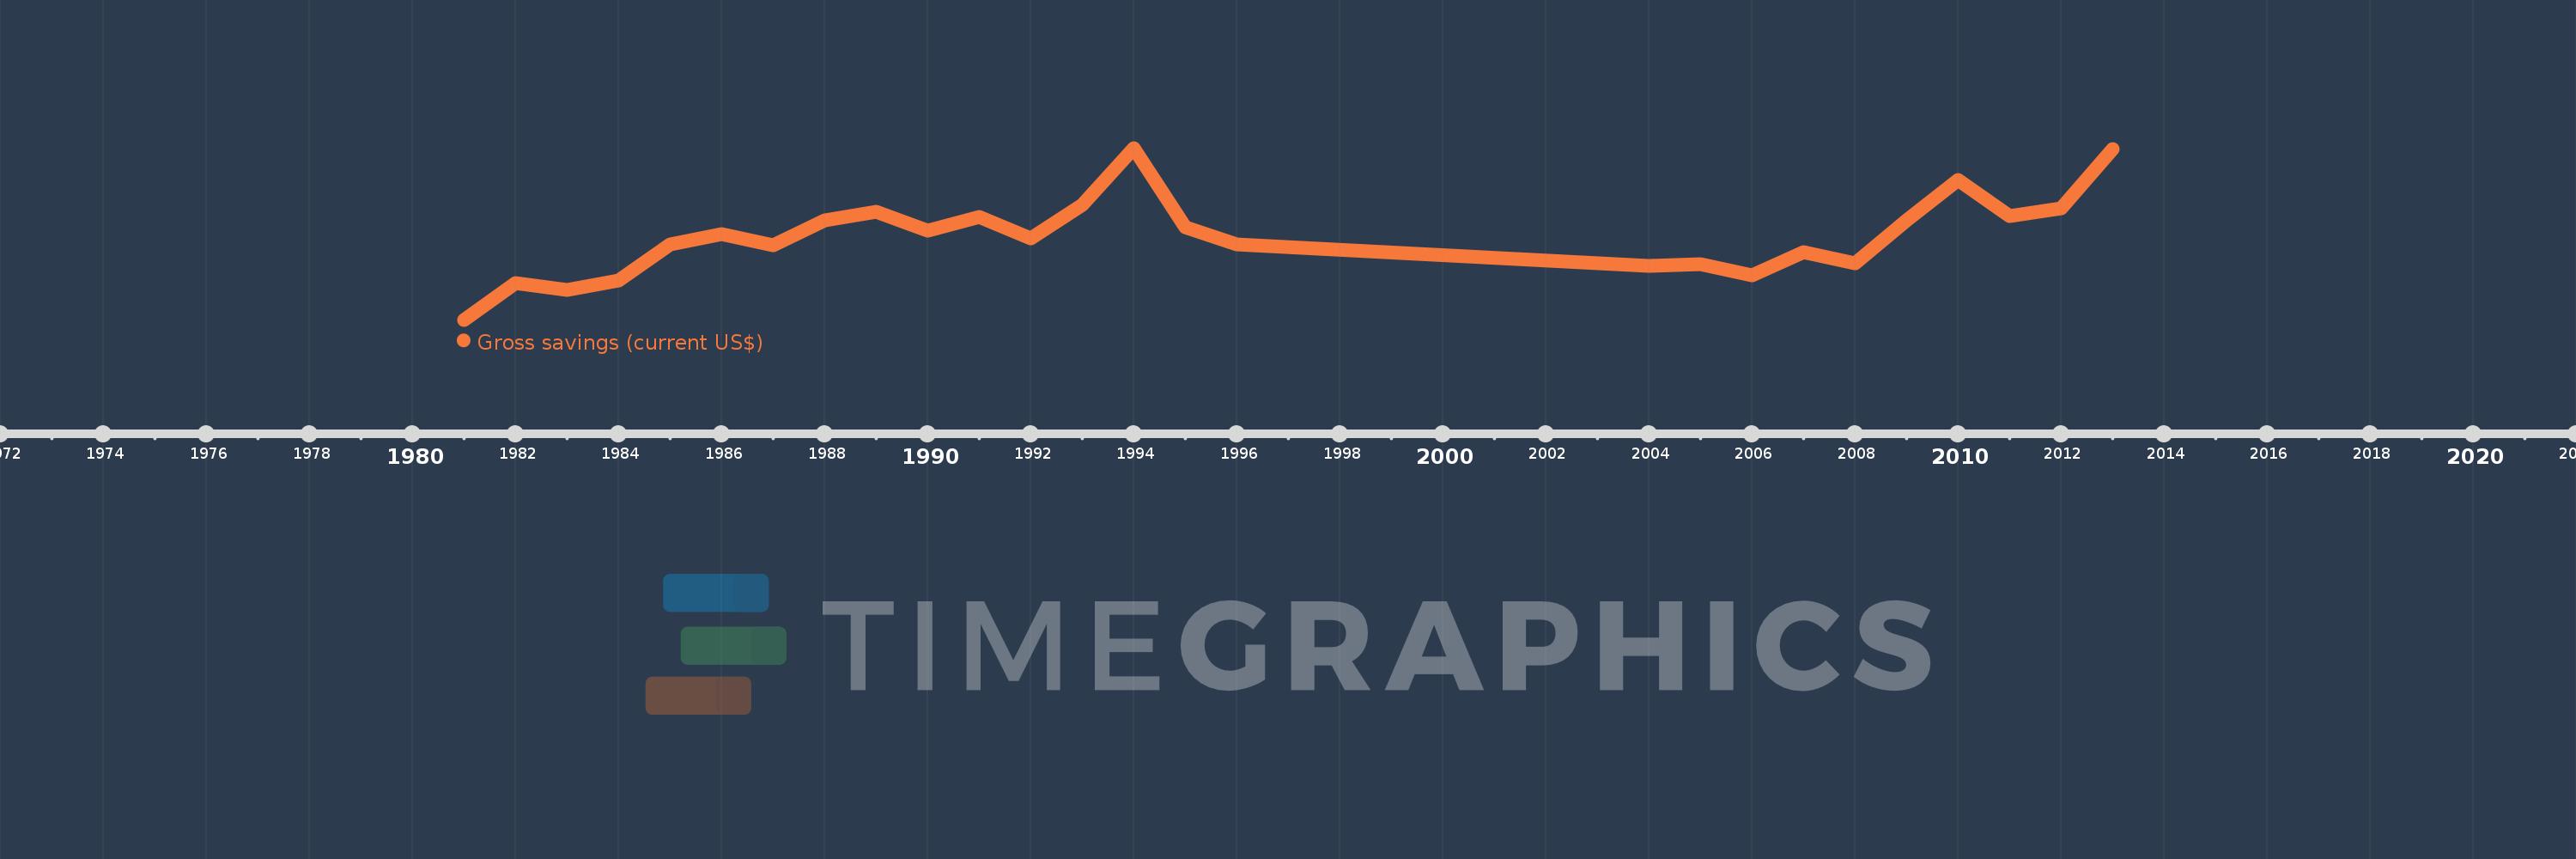
Cette échelle de temps montre un graphique de 1981 année à 2013 année Comoros. Les données jusqu'à 1980 année ne sont pas présentés. Quantité d'observations actuelles selon dates: 26.

Source (désignation):

Les indicateurs du développement mondiale

Source (organisation):

World Bank national accounts data, and OECD National Accounts data files.

Catégories:

Economy & Growth

Dernière mise à jour

23 avr. 2017

Les indicateurs de changement de valeurs selon les années

En moyenne:
29.163 mln.
Minimum:
-446.842 milles
1 janv. 1981
Maximum:
60.252 mln.
1 janv. 1994
Pour la date d''observation
Valeur
Changement absolu
Le changement par rapport à la valeur précédente
1 janv. 1981
-446.842 milles
-446.842 milles
0.0%
1 janv. 1982
12.571 mln.
+13.018 mln.
-2.91 milles%
1 janv. 1983
10.183 mln.
-2.388 mln.
-18.99%
1 janv. 1984
13.442 mln.
+3.259 mln.
32.0%
1 janv. 1985
26.16 mln.
+12.718 mln.
94.61%
1 janv. 1986
29.863 mln.
+3.703 mln.
14.16%
1 janv. 1987
25.73 mln.
-4.133 mln.
-13.84%
1 janv. 1988
34.746 mln.
+9.016 mln.
35.04%
1 janv. 1989
37.635 mln.
+2.889 mln.
8.32%
1 janv. 1990
31.05 mln.
-6.585 mln.
-17.5%
1 janv. 1991
35.962 mln.
+4.912 mln.
15.82%
1 janv. 1992
28.202 mln.
-7.759 mln.
-21.58%
1 janv. 1993
40.198 mln.
+11.996 mln.
42.53%
1 janv. 1994
60.252 mln.
+20.054 mln.
49.89%
1 janv. 1995
32.157 mln.
-28.095 mln.
-46.63%
1 janv. 1996
26.173 mln.
-5.984 mln.
-18.61%
1 janv. 2004
18.53 mln.
-7.643 mln.
-29.2%
1 janv. 2005
19.274 mln.
+744.005 milles
4.02%
1 janv. 2006
15.121 mln.
-4.153 mln.
-21.55%
1 janv. 2007
23.488 mln.
+8.368 mln.
55.34%
1 janv. 2008
19.603 mln.
-3.885 mln.
-16.54%
1 janv. 2009
34.695 mln.
+15.092 mln.
76.99%
1 janv. 2010
48.87 mln.
+14.175 mln.
40.86%
1 janv. 2011
36.112 mln.
-12.758 mln.
-26.11%
1 janv. 2012
38.776 mln.
+2.665 mln.
7.38%
1 janv. 2013
59.905 mln.
+21.128 mln.
54.49%

Classement des pays selon les statistiques actuelles par années