33
/fr/
AIzaSyAYiBZKx7MnpbEhh9jyipgxe19OcubqV5w
August 1, 2025
205345
Namibia
NAM
true
2
1
Gross savings (current US$)
2016,2015,2014,2013,2012,2011,2010,2009,2008,2007,2006,2005,2004,2003,2002,2001,2000,1999,1998,1997,1996,1995,1994,1993,1992,1991
Download
Bibliothèque de statistiques globales →Namibia →

Gross savings (current US$)

Cette statistique dans les autres pays:

AfghanistanAlbaniaAlgeriaAngolaAntigua and BarbudaArgentinaArmeniaAustraliaAustriaAzerbaijanBahamas, TheBahrainBangladeshBarbadosBelarusBelgiumBelizeBeninBermudaBhutanBoliviaBosnia and HerzegovinaBotswanaBrazilBrunei DarussalamBulgariaBurkina FasoBurundiCabo VerdeCambodiaCameroonCanadaCentral African RepublicChadChileChinaColombiaComorosCongo, Dem. Rep.Congo, Rep.Costa RicaCote d'IvoireCroatiaCyprusCzech RepublicDenmarkDjiboutiDominicaDominican RepublicEcuadorEgypt, Arab Rep.El SalvadorEquatorial GuineaEritreaEstoniaEthiopiaFaroe IslandsFijiFinlandFranceGabonGambia, TheGeorgiaGermanyGhanaGreeceGrenadaGuatemalaGuineaGuinea-BissauGuyanaHaitiHondurasHong Kong SAR, ChinaHungaryIcelandIndiaIndonesiaIran, Islamic Rep.IraqIrelandIsraelItalyJamaicaJapanJordanKazakhstanKenyaKiribatiKorea, Rep.KosovoKuwaitKyrgyz RepublicLao PDRLatviaLebanonLesothoLiberiaLibyaLithuaniaLuxembourgMacao SAR, ChinaMacedonia, FYRMadagascarMalawiMalaysiaMaldivesMaliMaltaMauritaniaMauritiusMexicoMoldovaMongoliaMontenegroMoroccoMozambiqueNamibiaNepalNetherlandsNew ZealandNicaraguaNigerNigeriaNorwayOmanPakistanPanamaPapua New GuineaParaguayPeruPhilippinesPolandPortugalQatarRomaniaRussian FederationRwandaSaudi ArabiaSenegalSerbiaSeychellesSierra LeoneSingaporeSlovak RepublicSloveniaSolomon IslandsSouth AfricaSouth SudanSpainSri LankaSt. Kitts and NevisSt. LuciaSt. Vincent and the GrenadinesSudanSurinameSwazilandSwedenSwitzerlandSyrian Arab RepublicTajikistanTanzaniaThailandTimor-LesteTogoTongaTrinidad and TobagoTunisiaTurkeyUgandaUkraineUnited KingdomUnited StatesUruguayVanuatuVenezuela, RBVietnamWest Bank and GazaYemen, Rep.ZambiaZimbabwe

La ligne de temps

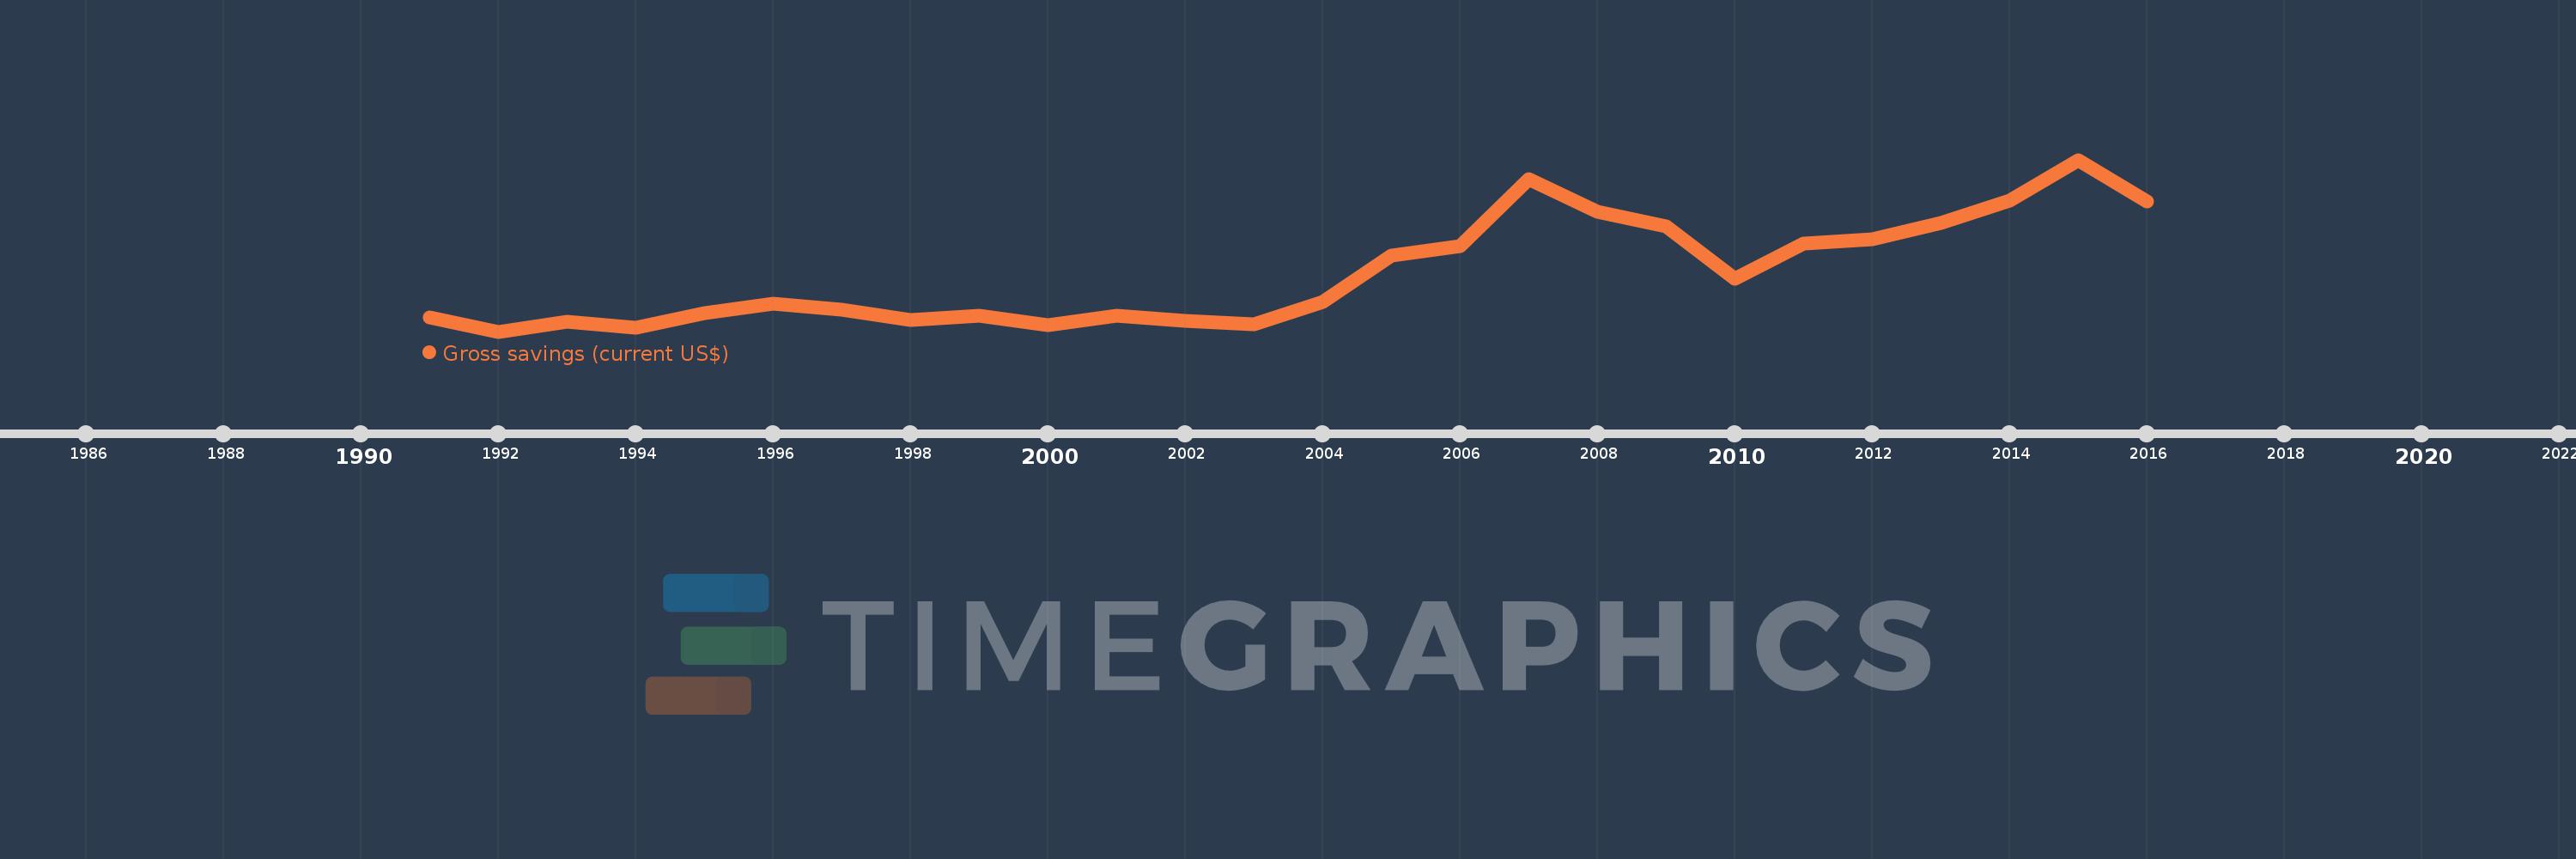
Cette échelle de temps montre un graphique de 1991 année à 2016 année Namibia. Les données jusqu'à 1990 année ne sont pas présentés. Quantité d'observations actuelles selon dates: 26.

Source (désignation):

Les indicateurs du développement mondiale

Source (organisation):

World Bank national accounts data, and OECD National Accounts data files.

Catégories:

Economy & Growth

Dernière mise à jour

23 avr. 2017

Les indicateurs de changement de valeurs selon les années

En moyenne:
1.604 mds
Minimum:
758.218 mln.
1 janv. 1992
Maximum:
3.263 mds
1 janv. 2015
Pour la date d''observation
Valeur
Changement absolu
Le changement par rapport à la valeur précédente
1 janv. 1991
961.49 mln.
+961.49 mln.
0.0%
1 janv. 1992
758.218 mln.
-203.273 mln.
-21.14%
1 janv. 1993
897.558 mln.
+139.341 mln.
18.38%
1 janv. 1994
810.42 mln.
-87.138 mln.
-9.71%
1 janv. 1995
1.03 mds
+219.389 mln.
27.07%
1 janv. 1996
1.163 mds
+133.388 mln.
12.95%
1 janv. 1997
1.076 mds
-86.745 mln.
-7.46%
1 janv. 1998
933.174 mln.
-143.278 mln.
-13.31%
1 janv. 1999
992.957 mln.
+59.783 mln.
6.41%
1 janv. 2000
856.695 mln.
-136.262 mln.
-13.72%
1 janv. 2001
994.135 mln.
+137.441 mln.
16.04%
1 janv. 2002
912.535 mln.
-81.601 mln.
-8.21%
1 janv. 2003
861.526 mln.
-51.008 mln.
-5.59%
1 janv. 2004
1.196 mds
+334.831 mln.
38.86%
1 janv. 2005
1.862 mds
+666.083 mln.
55.68%
1 janv. 2006
2.0 mds
+137.887 mln.
7.4%
1 janv. 2007
2.982 mds
+982.019 mln.
49.09%
1 janv. 2008
2.501 mds
-481.082 mln.
-16.13%
1 janv. 2009
2.293 mds
-208.349 mln.
-8.33%
1 janv. 2010
1.532 mds
-760.6 mln.
-33.17%
1 janv. 2011
2.047 mds
+514.596 mln.
33.58%
1 janv. 2012
2.11 mds
+63.212 mln.
3.09%
1 janv. 2013
2.349 mds
+238.92 mln.
11.32%
1 janv. 2014
2.67 mds
+320.868 mln.
13.66%
1 janv. 2015
3.263 mds
+593.549 mln.
22.23%
1 janv. 2016
2.652 mds
-611.771 mln.
-18.75%

Classement des pays selon les statistiques actuelles par années