33
/fr/
AIzaSyAYiBZKx7MnpbEhh9jyipgxe19OcubqV5w
May 1, 2025
265832
Tonga
TON
true
2
1
Gross savings (current US$)
2013,2012,2011,2010,2009,2008,2007,2006,2005,2004,2003,2002,1994,1993,1992,1991,1990,1989,1988,1987,1986,1985,1984,1983,1982
Download
Bibliothèque de statistiques globales →Tonga →

Gross savings (current US$)

Cette statistique dans les autres pays:

AfghanistanAlbaniaAlgeriaAngolaAntigua and BarbudaArgentinaArmeniaAustraliaAustriaAzerbaijanBahamas, TheBahrainBangladeshBarbadosBelarusBelgiumBelizeBeninBermudaBhutanBoliviaBosnia and HerzegovinaBotswanaBrazilBrunei DarussalamBulgariaBurkina FasoBurundiCabo VerdeCambodiaCameroonCanadaCentral African RepublicChadChileChinaColombiaComorosCongo, Dem. Rep.Congo, Rep.Costa RicaCote d'IvoireCroatiaCyprusCzech RepublicDenmarkDjiboutiDominicaDominican RepublicEcuadorEgypt, Arab Rep.El SalvadorEquatorial GuineaEritreaEstoniaEthiopiaFaroe IslandsFijiFinlandFranceGabonGambia, TheGeorgiaGermanyGhanaGreeceGrenadaGuatemalaGuineaGuinea-BissauGuyanaHaitiHondurasHong Kong SAR, ChinaHungaryIcelandIndiaIndonesiaIran, Islamic Rep.IraqIrelandIsraelItalyJamaicaJapanJordanKazakhstanKenyaKiribatiKorea, Rep.KosovoKuwaitKyrgyz RepublicLao PDRLatviaLebanonLesothoLiberiaLibyaLithuaniaLuxembourgMacao SAR, ChinaMacedonia, FYRMadagascarMalawiMalaysiaMaldivesMaliMaltaMauritaniaMauritiusMexicoMoldovaMongoliaMontenegroMoroccoMozambiqueNamibiaNepalNetherlandsNew ZealandNicaraguaNigerNigeriaNorwayOmanPakistanPanamaPapua New GuineaParaguayPeruPhilippinesPolandPortugalQatarRomaniaRussian FederationRwandaSaudi ArabiaSenegalSerbiaSeychellesSierra LeoneSingaporeSlovak RepublicSloveniaSolomon IslandsSouth AfricaSouth SudanSpainSri LankaSt. Kitts and NevisSt. LuciaSt. Vincent and the GrenadinesSudanSurinameSwazilandSwedenSwitzerlandSyrian Arab RepublicTajikistanTanzaniaThailandTimor-LesteTogoTongaTrinidad and TobagoTunisiaTurkeyUgandaUkraineUnited KingdomUnited StatesUruguayVanuatuVenezuela, RBVietnamWest Bank and GazaYemen, Rep.ZambiaZimbabwe

La ligne de temps

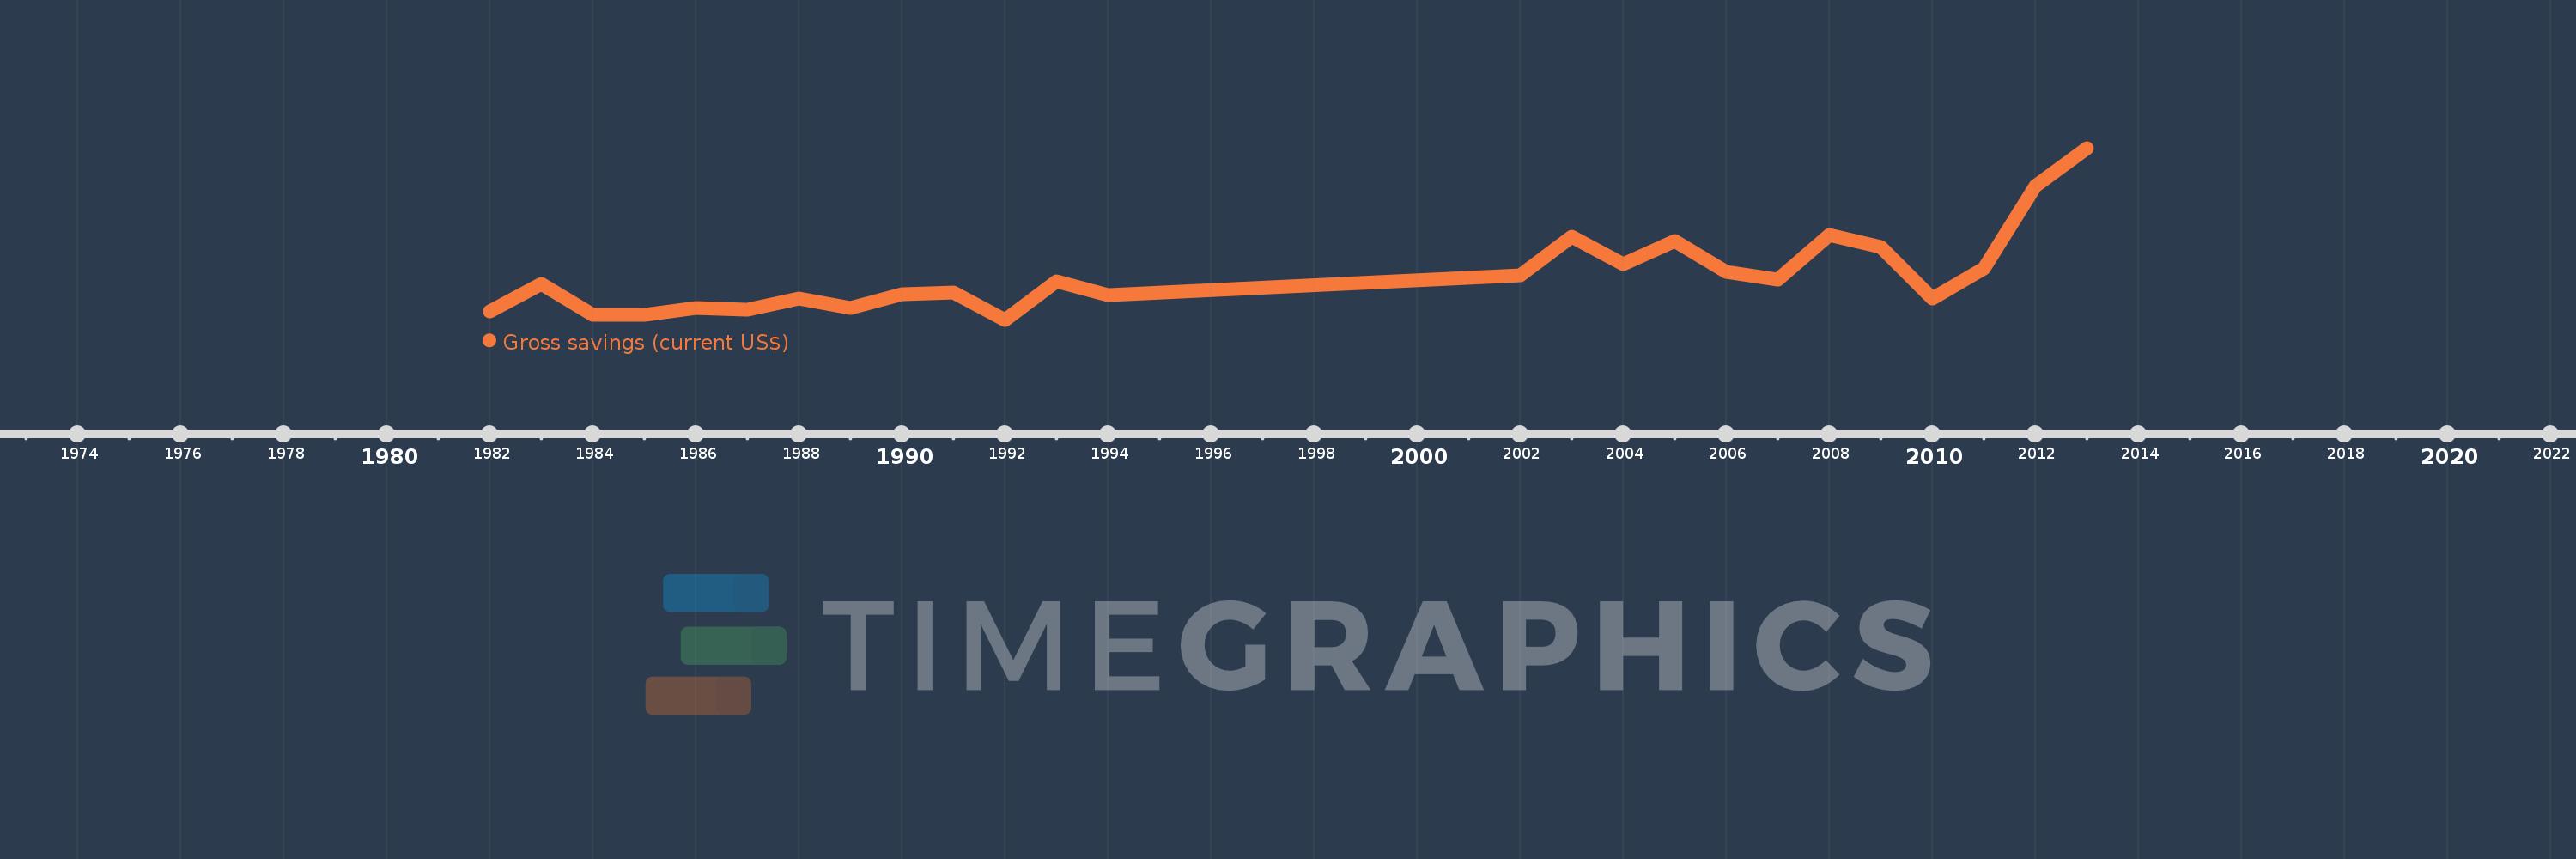
Cette échelle de temps montre un graphique de 1982 année à 2013 année Tonga. Les données jusqu'à 1981 année ne sont pas présentés. Quantité d'observations actuelles selon dates: 25.

Source (désignation):

Les indicateurs du développement mondiale

Source (organisation):

World Bank national accounts data, and OECD National Accounts data files.

Catégories:

Economy & Growth

Dernière mise à jour

23 avr. 2017

Les indicateurs de changement de valeurs selon les années

En moyenne:
35.879 mln.
Minimum:
10.175 mln.
1 janv. 1992
Maximum:
109.679 mln.
1 janv. 2013
Pour la date d''observation
Valeur
Changement absolu
Le changement par rapport à la valeur précédente
1 janv. 1982
15.181 mln.
+15.181 mln.
0.0%
1 janv. 1983
31.04 mln.
+15.858 mln.
104.46%
1 janv. 1984
13.019 mln.
-18.021 mln.
-58.06%
1 janv. 1985
12.894 mln.
-124.618 milles
-0.96%
1 janv. 1986
17.15 mln.
+4.255 mln.
33.0%
1 janv. 1987
16.232 mln.
-917.705 milles
-5.35%
1 janv. 1988
22.336 mln.
+6.105 mln.
37.61%
1 janv. 1989
17.148 mln.
-5.188 mln.
-23.23%
1 janv. 1990
24.943 mln.
+7.795 mln.
45.46%
1 janv. 1991
25.844 mln.
+901.005 milles
3.61%
1 janv. 1992
10.175 mln.
-15.669 mln.
-60.63%
1 janv. 1993
32.182 mln.
+22.007 mln.
216.27%
1 janv. 1994
24.442 mln.
-7.74 mln.
-24.05%
1 janv. 2002
35.866 mln.
+11.424 mln.
46.74%
1 janv. 2003
58.147 mln.
+22.281 mln.
62.12%
1 janv. 2004
42.469 mln.
-15.678 mln.
-26.96%
1 janv. 2005
55.798 mln.
+13.329 mln.
31.39%
1 janv. 2006
37.727 mln.
-18.071 mln.
-32.39%
1 janv. 2007
33.315 mln.
-4.411 mln.
-11.69%
1 janv. 2008
59.253 mln.
+25.937 mln.
77.85%
1 janv. 2009
52.511 mln.
-6.741 mln.
-11.38%
1 janv. 2010
22.368 mln.
-30.143 mln.
-57.4%
1 janv. 2011
39.843 mln.
+17.475 mln.
78.12%
1 janv. 2012
87.418 mln.
+47.575 mln.
119.41%
1 janv. 2013
109.679 mln.
+22.261 mln.
25.46%

Classement des pays selon les statistiques actuelles par années