33
/fr/
AIzaSyAYiBZKx7MnpbEhh9jyipgxe19OcubqV5w
August 1, 2025
145743
Guinea
GIN
true
2
1
Gross savings (current US$)
2014,2013,2012,2011,2010,2009,2008,2007,2006,2005,2004,2003,2002,2001,2000,1999,1998,1997,1996,1995,1994,1993,1992,1991,1990,1989,1988,1987
Download
Bibliothèque de statistiques globales →Guinea →

Gross savings (current US$)

Cette statistique dans les autres pays:

AfghanistanAlbaniaAlgeriaAngolaAntigua and BarbudaArgentinaArmeniaAustraliaAustriaAzerbaijanBahamas, TheBahrainBangladeshBarbadosBelarusBelgiumBelizeBeninBermudaBhutanBoliviaBosnia and HerzegovinaBotswanaBrazilBrunei DarussalamBulgariaBurkina FasoBurundiCabo VerdeCambodiaCameroonCanadaCentral African RepublicChadChileChinaColombiaComorosCongo, Dem. Rep.Congo, Rep.Costa RicaCote d'IvoireCroatiaCyprusCzech RepublicDenmarkDjiboutiDominicaDominican RepublicEcuadorEgypt, Arab Rep.El SalvadorEquatorial GuineaEritreaEstoniaEthiopiaFaroe IslandsFijiFinlandFranceGabonGambia, TheGeorgiaGermanyGhanaGreeceGrenadaGuatemalaGuineaGuinea-BissauGuyanaHaitiHondurasHong Kong SAR, ChinaHungaryIcelandIndiaIndonesiaIran, Islamic Rep.IraqIrelandIsraelItalyJamaicaJapanJordanKazakhstanKenyaKiribatiKorea, Rep.KosovoKuwaitKyrgyz RepublicLao PDRLatviaLebanonLesothoLiberiaLibyaLithuaniaLuxembourgMacao SAR, ChinaMacedonia, FYRMadagascarMalawiMalaysiaMaldivesMaliMaltaMauritaniaMauritiusMexicoMoldovaMongoliaMontenegroMoroccoMozambiqueNamibiaNepalNetherlandsNew ZealandNicaraguaNigerNigeriaNorwayOmanPakistanPanamaPapua New GuineaParaguayPeruPhilippinesPolandPortugalQatarRomaniaRussian FederationRwandaSaudi ArabiaSenegalSerbiaSeychellesSierra LeoneSingaporeSlovak RepublicSloveniaSolomon IslandsSouth AfricaSouth SudanSpainSri LankaSt. Kitts and NevisSt. LuciaSt. Vincent and the GrenadinesSudanSurinameSwazilandSwedenSwitzerlandSyrian Arab RepublicTajikistanTanzaniaThailandTimor-LesteTogoTongaTrinidad and TobagoTunisiaTurkeyUgandaUkraineUnited KingdomUnited StatesUruguayVanuatuVenezuela, RBVietnamWest Bank and GazaYemen, Rep.ZambiaZimbabwe

La ligne de temps

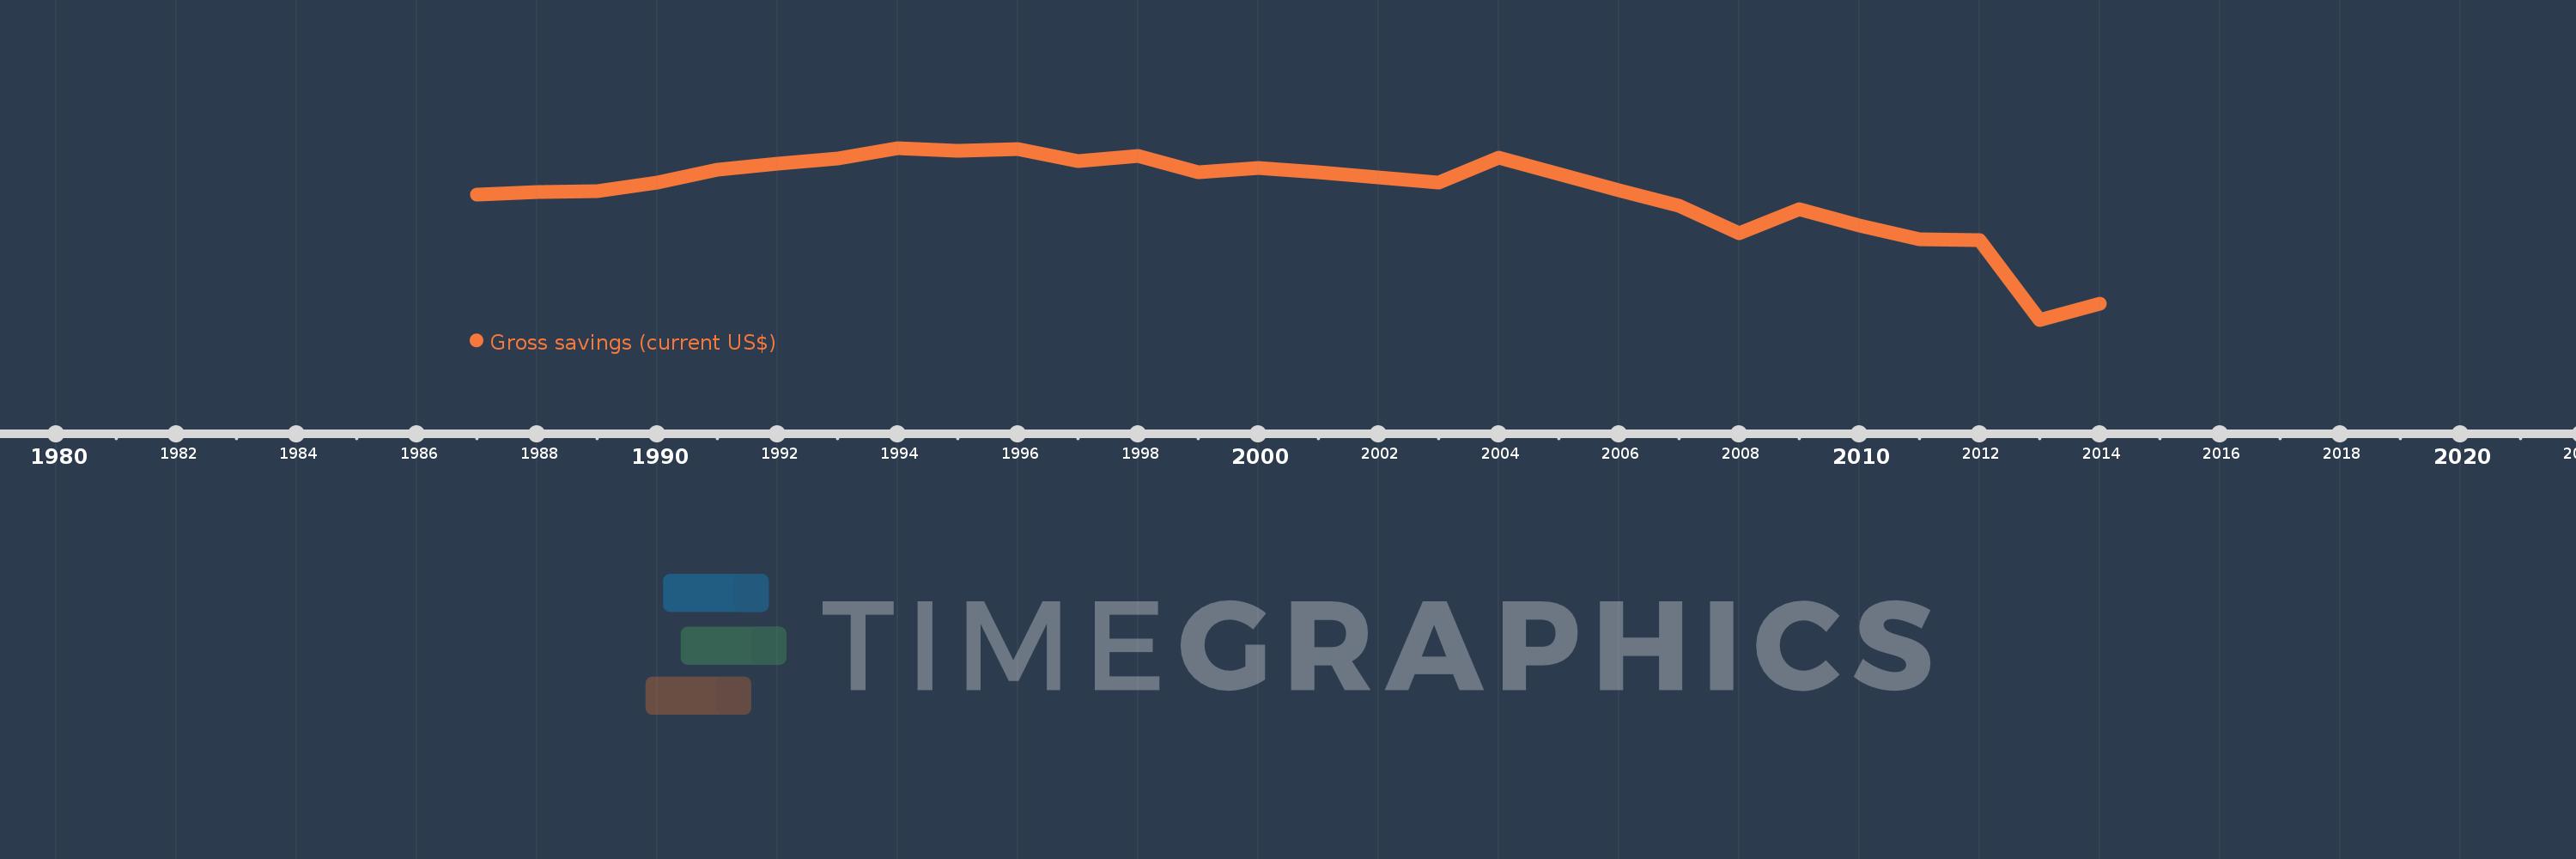
Cette échelle de temps montre un graphique de 1987 année à 2014 année Guinea. Les données jusqu'à 1986 année ne sont pas présentés. Quantité d'observations actuelles selon dates: 28.

Source (désignation):

Les indicateurs du développement mondiale

Source (organisation):

World Bank national accounts data, and OECD National Accounts data files.

Catégories:

Economy & Growth

Dernière mise à jour

23 avr. 2017

Les indicateurs de changement de valeurs selon les années

En moyenne:
248.301 mln.
Minimum:
-1.253 mds
1 janv. 2013
Maximum:
772.885 mln.
1 janv. 1994
Pour la date d''observation
Valeur
Changement absolu
Le changement par rapport à la valeur précédente
1 janv. 1987
219.067 mln.
+219.067 mln.
0.0%
1 janv. 1988
248.59 mln.
+29.523 mln.
13.48%
1 janv. 1989
262.635 mln.
+14.045 mln.
5.65%
1 janv. 1990
362.026 mln.
+99.39 mln.
37.84%
1 janv. 1991
512.253 mln.
+150.227 mln.
41.5%
1 janv. 1992
589.238 mln.
+76.986 mln.
15.03%
1 janv. 1993
648.916 mln.
+59.678 mln.
10.13%
1 janv. 1994
772.885 mln.
+123.969 mln.
19.1%
1 janv. 1995
739.912 mln.
-32.973 mln.
-4.27%
1 janv. 1996
762.764 mln.
+22.853 mln.
3.09%
1 janv. 1997
618.408 mln.
-144.357 mln.
-18.93%
1 janv. 1998
675.231 mln.
+56.823 mln.
9.19%
1 janv. 1999
488.407 mln.
-186.824 mln.
-27.67%
1 janv. 2000
534.298 mln.
+45.891 mln.
9.4%
1 janv. 2001
482.527 mln.
-51.771 mln.
-9.69%
1 janv. 2002
428.697 mln.
-53.83 mln.
-11.16%
1 janv. 2003
368.626 mln.
-60.071 mln.
-14.01%
1 janv. 2004
661.216 mln.
+292.59 mln.
79.37%
1 janv. 2005
462.809 mln.
-198.407 mln.
-30.01%
1 janv. 2006
274.979 mln.
-187.83 mln.
-40.58%
1 janv. 2007
86.976 mln.
-188.003 mln.
-68.37%
1 janv. 2008
-228.622 mln.
-315.598 mln.
-362.86%
1 janv. 2009
53.96 mln.
+282.582 mln.
-123.6%
1 janv. 2010
-137.449 mln.
-191.409 mln.
-354.73%
1 janv. 2011
-303.49 mln.
-166.041 mln.
120.8%
1 janv. 2012
-316.647 mln.
-13.156 mln.
4.34%
1 janv. 2013
-1.253 mds
-936.329 mln.
295.7%
1 janv. 2014
-1.063 mds
+190.159 mln.
-15.18%

Classement des pays selon les statistiques actuelles par années