33
/de/
AIzaSyAYiBZKx7MnpbEhh9jyipgxe19OcubqV5w
August 1, 2025
91561
Brazil
BRA
true
2
1
Net official flows from UN agencies, UNHCR (current US$)
2013,2012,2011,2010,2009,2008,2007,2006,2005,1999,1998,1997,1996,1995,1994,1993,1992,1991,1985
Download
Bibliothek der Globalstatistik →Brazil →

Net official flows from UN agencies, UNHCR (current US$)

Diese Statistik in anderen Ländern:

AfghanistanAlbaniaAlgeriaAngolaArab WorldArgentinaArmeniaAzerbaijanBahrainBangladeshBelarusBelizeBeninBoliviaBosnia and HerzegovinaBotswanaBrazilBulgariaBurkina FasoBurundiCabo VerdeCambodiaCameroonCaribbean small statesCentral African RepublicCentral Europe and the BalticsChadChileChinaColombiaComorosCongo, Dem. Rep.Congo, Rep.Costa RicaCote d'IvoireCroatiaCubaCyprusCzech RepublicDjiboutiDominican RepublicEast Asia & PacificEast Asia & Pacific (excluding high income)East Asia & Pacific (IDA & IBRD countries)EcuadorEgypt, Arab Rep.El SalvadorEquatorial GuineaEritreaEthiopiaEuro areaEurope & Central AsiaEurope & Central Asia (excluding high income)Europe & Central Asia (IDA & IBRD countries)European UnionFragile and conflict affected situationsGabonGambia, TheGeorgiaGhanaGuatemalaGuineaGuinea-BissauHaitiHeavily indebted poor countries (HIPC)High incomeHondurasHong Kong SAR, ChinaHungaryIBRD onlyIDA & IBRD totalIDA blendIDA onlyIDA totalIndiaIndonesiaIran, Islamic Rep.IraqIsraelJamaicaJordanKazakhstanKenyaKorea, Dem. People’s Rep.Korea, Rep.KosovoKuwaitKyrgyz RepublicLao PDRLatin America & Caribbean Latin America & Caribbean (excluding high income)Latin America & the Caribbean (IDA & IBRD countries)LatviaLeast developed countries: UN classificationLebanonLesothoLiberiaLibyaLow & middle incomeLow incomeLower middle incomeMacao SAR, ChinaMacedonia, FYRMadagascarMalawiMalaysiaMaliMaltaMauritaniaMexicoMiddle East & North AfricaMiddle East & North Africa (excluding high income)Middle East & North Africa (IDA & IBRD countries)Middle incomeMoldovaMongoliaMontenegroMoroccoMozambiqueMyanmarNamibiaNepalNicaraguaNigerNigeriaOECD membersOther small statesPakistanPanamaPapua New GuineaParaguayPeruPhilippinesPolandRomaniaRussian FederationRwandaSao Tome and PrincipeSaudi ArabiaSenegalSerbiaSierra LeoneSingaporeSlovak RepublicSloveniaSmall statesSomaliaSouth AfricaSouth AsiaSouth Asia (IDA & IBRD)South SudanSri LankaSub-Saharan Africa Sub-Saharan Africa (excluding high income)Sub-Saharan Africa (IDA & IBRD countries)SudanSurinameSwazilandSyrian Arab RepublicTajikistanTanzaniaThailandTimor-LesteTogoTunisiaTurkeyTurkmenistanUgandaUkraineUnited Arab EmiratesUpper middle incomeUruguayUzbekistanVenezuela, RBVietnamWorldYemen, Rep.ZambiaZimbabwe

Zeitlinie:

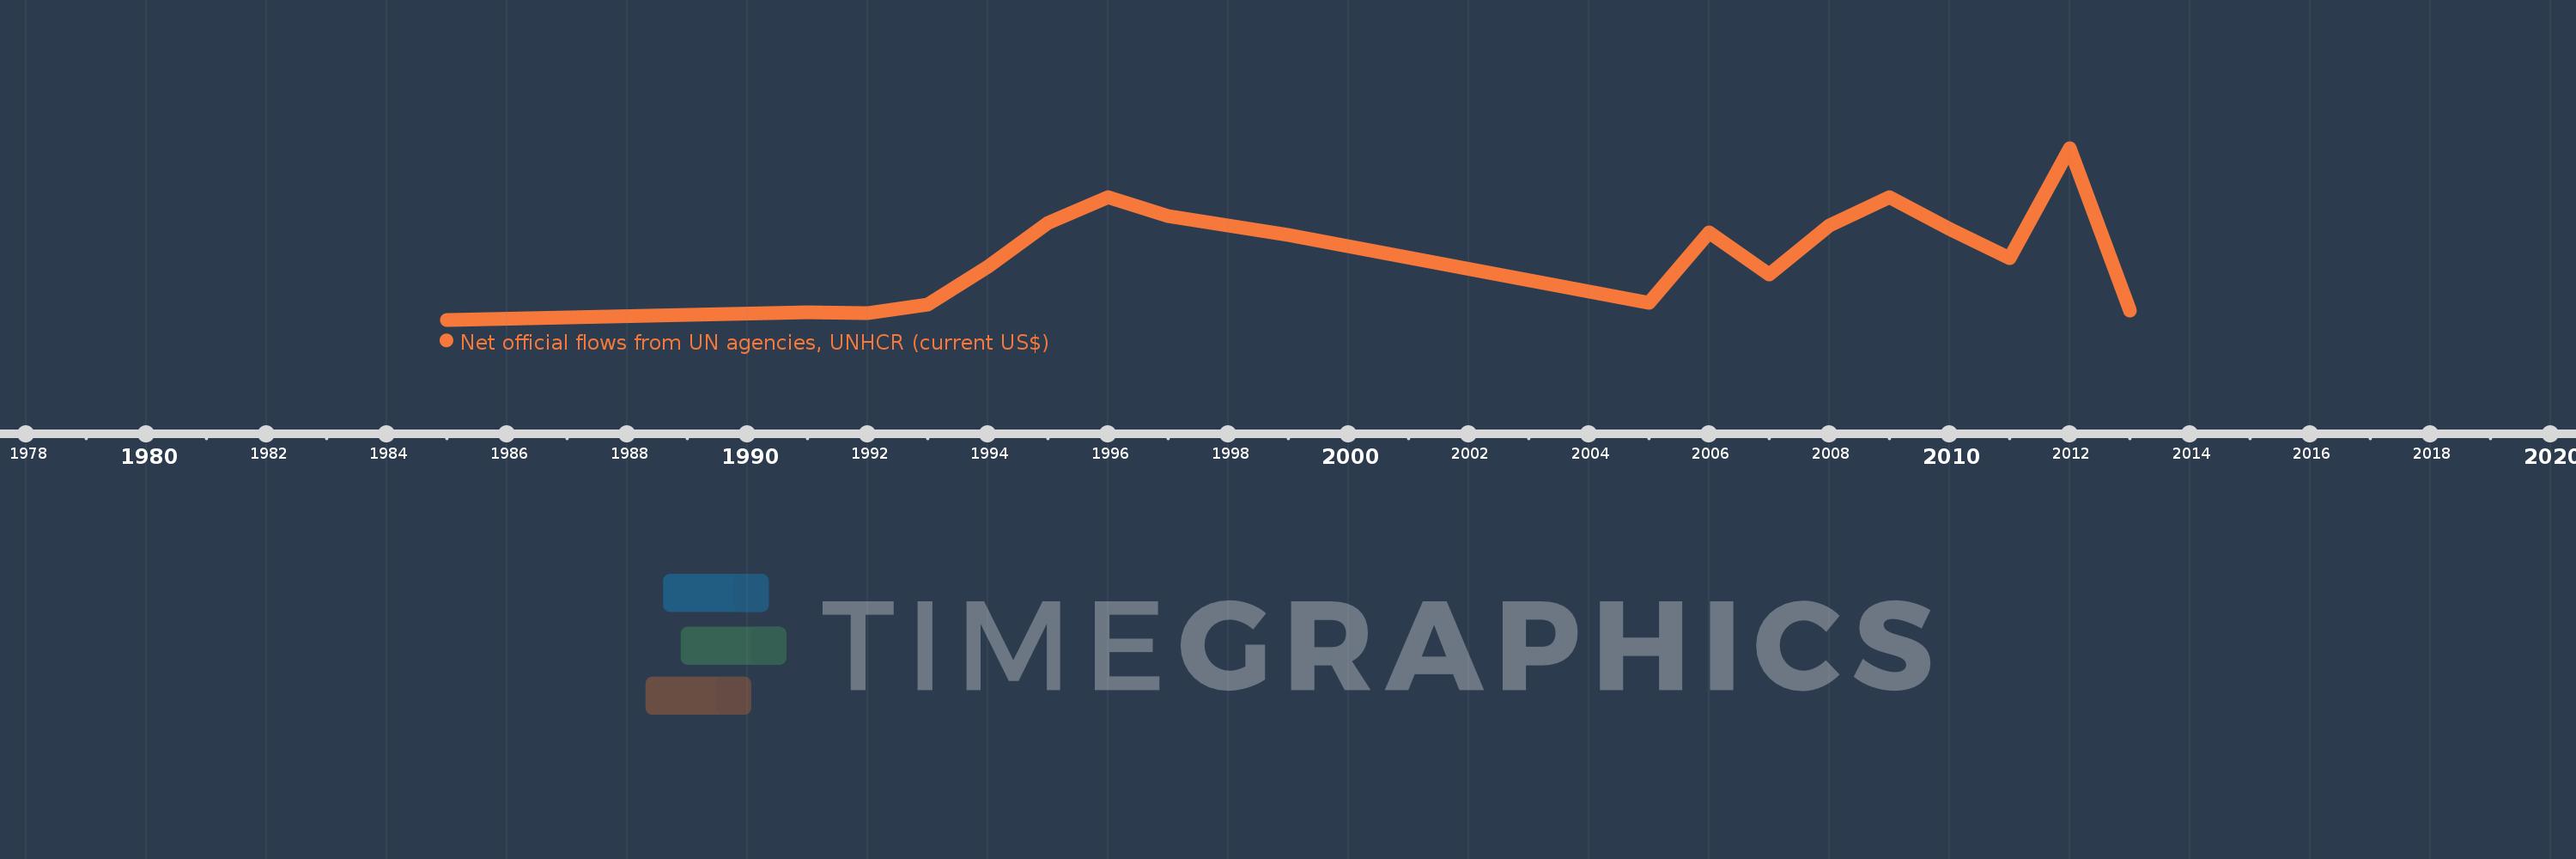
Diese Zeitleiste vorliegt die Graphik ab 1985 J. bis 2013 J. Brazil. Die Angaben bis 1984 J. sind nicht vorhanden. Die Zahl aktueller Beobachtungen nach Daten: 19.

Die Quelle (Bezeichnung):

Kennzahlen der Weltentwicklung

Die Quelle (Einrichtung):

Development Assistance Committee of the Organisation for Economic Co-operation and Development, Geographical Distribution of Financial Flows to Developing Countries, Development Co-operation Report, and International Development Statistics database. Data are available online at: www.oecd.org/dac/stats/idsonline.

Kategorien:

Aid Effectiveness

Es wurde aktualisiert:

23 Apr 2017 Jahr

Kennzahlen der Wertänderungen vom Jahr zum Jahr

im Durchschnitt:
1.169 Mln.
Minimum:
20.0 Tsnd.
1 Jan 1985 Jahr
Maximum:
2.94 Mln.
1 Jan 2012 Jahr
Zum Datum der Beobachtung
Wert
Absolute Veränderung
Die Veränderung bezüglich dem vorherigen Wert
1 Jan 1985 Jahr
20.0 Tsnd.
+20.0 Tsnd.
0.0%
1 Jan 1991 Jahr
150.0 Tsnd.
+130.0 Tsnd.
650.0%
1 Jan 1992 Jahr
130.0 Tsnd.
-20.0 Tsnd.
-13.33%
1 Jan 1993 Jahr
280.0 Tsnd.
+150.0 Tsnd.
115.38%
1 Jan 1994 Jahr
920.0 Tsnd.
+640.0 Tsnd.
228.57%
1 Jan 1995 Jahr
1.67 Mln.
+750.0 Tsnd.
81.52%
1 Jan 1996 Jahr
2.1 Mln.
+430.0 Tsnd.
25.75%
1 Jan 1997 Jahr
1.78 Mln.
-320.0 Tsnd.
-15.24%
1 Jan 1998 Jahr
1.62 Mln.
-160.0 Tsnd.
-8.99%
1 Jan 1999 Jahr
1.46 Mln.
-160.0 Tsnd.
-9.88%
1 Jan 2005 Jahr
310.0 Tsnd.
-1.15 Mln.
-78.77%
1 Jan 2006 Jahr
1.51 Mln.
+1.2 Mln.
387.1%
1 Jan 2007 Jahr
790.0 Tsnd.
-720.0 Tsnd.
-47.68%
1 Jan 2008 Jahr
1.62 Mln.
+830.0 Tsnd.
105.06%
1 Jan 2009 Jahr
2.11 Mln.
+490.0 Tsnd.
30.25%
1 Jan 2010 Jahr
1.57 Mln.
-540.0 Tsnd.
-25.59%
1 Jan 2011 Jahr
1.06 Mln.
-510.0 Tsnd.
-32.48%
1 Jan 2012 Jahr
2.94 Mln.
+1.88 Mln.
177.36%
1 Jan 2013 Jahr
170.0 Tsnd.
-2.77 Mln.
-94.22%

Bewertung der Länder gemäß mit laufender Statistik nach Jahren