33
/de/
AIzaSyAYiBZKx7MnpbEhh9jyipgxe19OcubqV5w
August 1, 2025
275070
United Arab Emirates
ARE
true
2
1
Net official flows from UN agencies, UNHCR (current US$)
2002,2001,1993,1992,1991,1979,1978,1977,1976,1975,1974,1973,1972,1971,1970
Download
Bibliothek der Globalstatistik →United Arab Emirates →

Net official flows from UN agencies, UNHCR (current US$)

Diese Statistik in anderen Ländern:

AfghanistanAlbaniaAlgeriaAngolaArab WorldArgentinaArmeniaAzerbaijanBahrainBangladeshBelarusBelizeBeninBoliviaBosnia and HerzegovinaBotswanaBrazilBulgariaBurkina FasoBurundiCabo VerdeCambodiaCameroonCaribbean small statesCentral African RepublicCentral Europe and the BalticsChadChileChinaColombiaComorosCongo, Dem. Rep.Congo, Rep.Costa RicaCote d'IvoireCroatiaCubaCyprusCzech RepublicDjiboutiDominican RepublicEast Asia & PacificEast Asia & Pacific (excluding high income)East Asia & Pacific (IDA & IBRD countries)EcuadorEgypt, Arab Rep.El SalvadorEquatorial GuineaEritreaEthiopiaEuro areaEurope & Central AsiaEurope & Central Asia (excluding high income)Europe & Central Asia (IDA & IBRD countries)European UnionFragile and conflict affected situationsGabonGambia, TheGeorgiaGhanaGuatemalaGuineaGuinea-BissauHaitiHeavily indebted poor countries (HIPC)High incomeHondurasHong Kong SAR, ChinaHungaryIBRD onlyIDA & IBRD totalIDA blendIDA onlyIDA totalIndiaIndonesiaIran, Islamic Rep.IraqIsraelJamaicaJordanKazakhstanKenyaKorea, Dem. People’s Rep.Korea, Rep.KosovoKuwaitKyrgyz RepublicLao PDRLatin America & Caribbean Latin America & Caribbean (excluding high income)Latin America & the Caribbean (IDA & IBRD countries)LatviaLeast developed countries: UN classificationLebanonLesothoLiberiaLibyaLow & middle incomeLow incomeLower middle incomeMacao SAR, ChinaMacedonia, FYRMadagascarMalawiMalaysiaMaliMaltaMauritaniaMexicoMiddle East & North AfricaMiddle East & North Africa (excluding high income)Middle East & North Africa (IDA & IBRD countries)Middle incomeMoldovaMongoliaMontenegroMoroccoMozambiqueMyanmarNamibiaNepalNicaraguaNigerNigeriaOECD membersOther small statesPakistanPanamaPapua New GuineaParaguayPeruPhilippinesPolandRomaniaRussian FederationRwandaSao Tome and PrincipeSaudi ArabiaSenegalSerbiaSierra LeoneSingaporeSlovak RepublicSloveniaSmall statesSomaliaSouth AfricaSouth AsiaSouth Asia (IDA & IBRD)South SudanSri LankaSub-Saharan Africa Sub-Saharan Africa (excluding high income)Sub-Saharan Africa (IDA & IBRD countries)SudanSurinameSwazilandSyrian Arab RepublicTajikistanTanzaniaThailandTimor-LesteTogoTunisiaTurkeyTurkmenistanUgandaUkraineUnited Arab EmiratesUpper middle incomeUruguayUzbekistanVenezuela, RBVietnamWorldYemen, Rep.ZambiaZimbabwe

Zeitlinie:

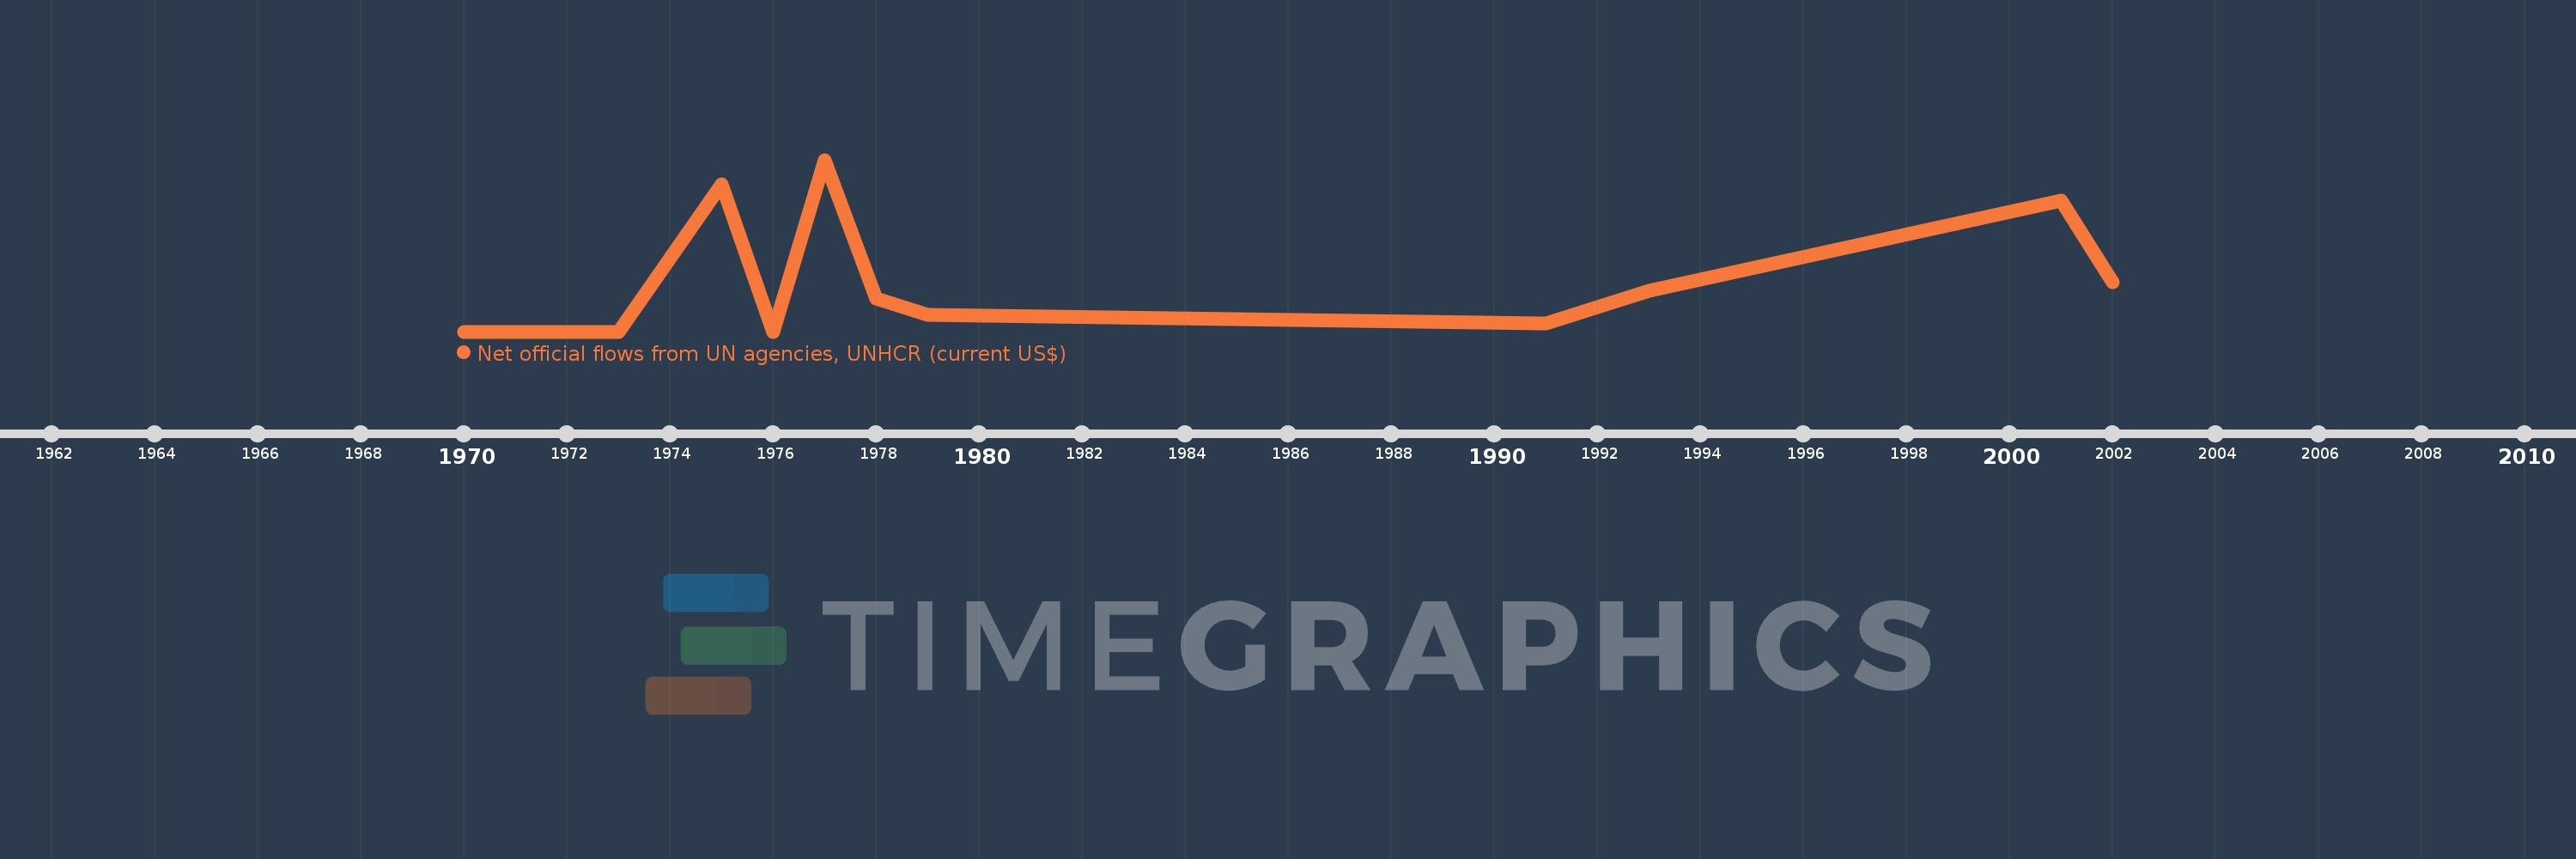
Diese Zeitleiste vorliegt die Graphik ab 1970 J. bis 2002 J. United Arab Emirates. Die Angaben bis 1969 J. sind nicht vorhanden. Die Zahl aktueller Beobachtungen nach Daten: 15.

Die Quelle (Bezeichnung):

Kennzahlen der Weltentwicklung

Die Quelle (Einrichtung):

Development Assistance Committee of the Organisation for Economic Co-operation and Development, Geographical Distribution of Financial Flows to Developing Countries, Development Co-operation Report, and International Development Statistics database. Data are available online at: www.oecd.org/dac/stats/idsonline.

Kategorien:

Aid Effectiveness

Es wurde aktualisiert:

23 Apr 2017 Jahr

Kennzahlen der Wertänderungen vom Jahr zum Jahr

im Durchschnitt:
66.667 Tsnd.
Minimum:
10.0 Tsnd.
1 Jan 1970 Jahr
Maximum:
220.0 Tsnd.
1 Jan 1977 Jahr
Zum Datum der Beobachtung
Wert
Absolute Veränderung
Die Veränderung bezüglich dem vorherigen Wert
1 Jan 1970 Jahr
10.0 Tsnd.
+10.0 Tsnd.
0.0%
1 Jan 1971 Jahr
10.0 Tsnd.
0.0
0.0%
1 Jan 1972 Jahr
10.0 Tsnd.
0.0
0.0%
1 Jan 1973 Jahr
10.0 Tsnd.
0.0
0.0%
1 Jan 1974 Jahr
100.0 Tsnd.
+90.0 Tsnd.
900.0%
1 Jan 1975 Jahr
190.0 Tsnd.
+90.0 Tsnd.
90.0%
1 Jan 1976 Jahr
10.0 Tsnd.
-180.0 Tsnd.
-94.74%
1 Jan 1977 Jahr
220.0 Tsnd.
+210.0 Tsnd.
2.1 Tsnd.%
1 Jan 1978 Jahr
50.0 Tsnd.
-170.0 Tsnd.
-77.27%
1 Jan 1979 Jahr
30.0 Tsnd.
-20.0 Tsnd.
-40.0%
1 Jan 1991 Jahr
20.0 Tsnd.
-10.0 Tsnd.
-33.33%
1 Jan 1992 Jahr
40.0 Tsnd.
+20.0 Tsnd.
100.0%
1 Jan 1993 Jahr
60.0 Tsnd.
+20.0 Tsnd.
50.0%
1 Jan 2001 Jahr
170.0 Tsnd.
+110.0 Tsnd.
183.33%
1 Jan 2002 Jahr
70.0 Tsnd.
-100.0 Tsnd.
-58.82%

Bewertung der Länder gemäß mit laufender Statistik nach Jahren