33
/de/
AIzaSyAYiBZKx7MnpbEhh9jyipgxe19OcubqV5w
August 1, 2025
246007
South Africa
ZAF
true
2
1
Net official flows from UN agencies, UNHCR (current US$)
2014,2013,2012,2011,2010,2009,2008,2007,2006,2005,2004,2003,2002,2001,2000,1999,1998,1997,1996,1995,1994
Download
Bibliothek der Globalstatistik →South Africa →

Net official flows from UN agencies, UNHCR (current US$)

Diese Statistik in anderen Ländern:

AfghanistanAlbaniaAlgeriaAngolaArab WorldArgentinaArmeniaAzerbaijanBahrainBangladeshBelarusBelizeBeninBoliviaBosnia and HerzegovinaBotswanaBrazilBulgariaBurkina FasoBurundiCabo VerdeCambodiaCameroonCaribbean small statesCentral African RepublicCentral Europe and the BalticsChadChileChinaColombiaComorosCongo, Dem. Rep.Congo, Rep.Costa RicaCote d'IvoireCroatiaCubaCyprusCzech RepublicDjiboutiDominican RepublicEast Asia & PacificEast Asia & Pacific (excluding high income)East Asia & Pacific (IDA & IBRD countries)EcuadorEgypt, Arab Rep.El SalvadorEquatorial GuineaEritreaEthiopiaEuro areaEurope & Central AsiaEurope & Central Asia (excluding high income)Europe & Central Asia (IDA & IBRD countries)European UnionFragile and conflict affected situationsGabonGambia, TheGeorgiaGhanaGuatemalaGuineaGuinea-BissauHaitiHeavily indebted poor countries (HIPC)High incomeHondurasHong Kong SAR, ChinaHungaryIBRD onlyIDA & IBRD totalIDA blendIDA onlyIDA totalIndiaIndonesiaIran, Islamic Rep.IraqIsraelJamaicaJordanKazakhstanKenyaKorea, Dem. People’s Rep.Korea, Rep.KosovoKuwaitKyrgyz RepublicLao PDRLatin America & Caribbean Latin America & Caribbean (excluding high income)Latin America & the Caribbean (IDA & IBRD countries)LatviaLeast developed countries: UN classificationLebanonLesothoLiberiaLibyaLow & middle incomeLow incomeLower middle incomeMacao SAR, ChinaMacedonia, FYRMadagascarMalawiMalaysiaMaliMaltaMauritaniaMexicoMiddle East & North AfricaMiddle East & North Africa (excluding high income)Middle East & North Africa (IDA & IBRD countries)Middle incomeMoldovaMongoliaMontenegroMoroccoMozambiqueMyanmarNamibiaNepalNicaraguaNigerNigeriaOECD membersOther small statesPakistanPanamaPapua New GuineaParaguayPeruPhilippinesPolandRomaniaRussian FederationRwandaSao Tome and PrincipeSaudi ArabiaSenegalSerbiaSierra LeoneSingaporeSlovak RepublicSloveniaSmall statesSomaliaSouth AfricaSouth AsiaSouth Asia (IDA & IBRD)South SudanSri LankaSub-Saharan Africa Sub-Saharan Africa (excluding high income)Sub-Saharan Africa (IDA & IBRD countries)SudanSurinameSwazilandSyrian Arab RepublicTajikistanTanzaniaThailandTimor-LesteTogoTunisiaTurkeyTurkmenistanUgandaUkraineUnited Arab EmiratesUpper middle incomeUruguayUzbekistanVenezuela, RBVietnamWorldYemen, Rep.ZambiaZimbabwe

Zeitlinie:

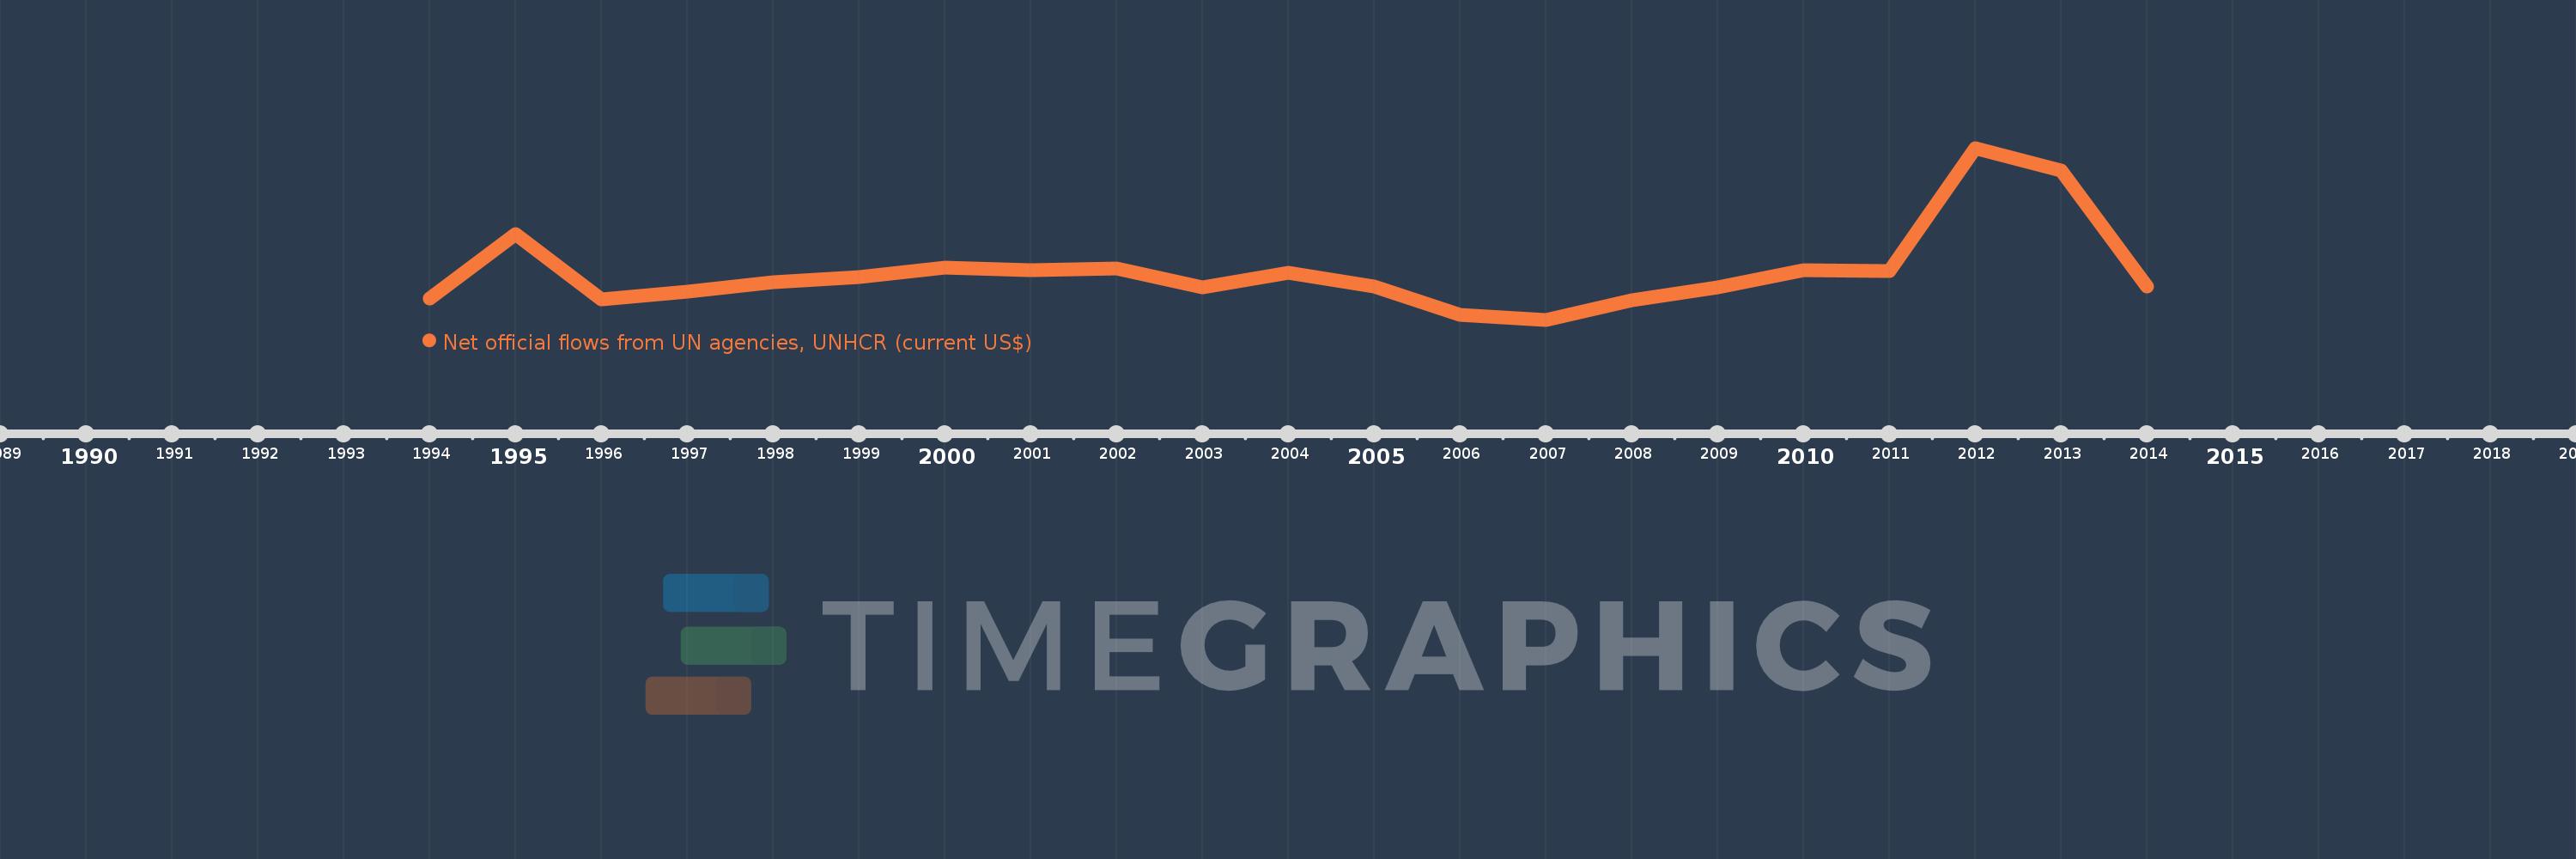
Diese Zeitleiste vorliegt die Graphik ab 1994 J. bis 2014 J. South Africa. Die Angaben bis 1993 J. sind nicht vorhanden. Die Zahl aktueller Beobachtungen nach Daten: 21.

Die Quelle (Bezeichnung):

Kennzahlen der Weltentwicklung

Die Quelle (Einrichtung):

Development Assistance Committee of the Organisation for Economic Co-operation and Development, Geographical Distribution of Financial Flows to Developing Countries, Development Co-operation Report, and International Development Statistics database. Data are available online at: www.oecd.org/dac/stats/idsonline.

Kategorien:

Aid Effectiveness

Es wurde aktualisiert:

23 Apr 2017 Jahr

Kennzahlen der Wertänderungen vom Jahr zum Jahr

im Durchschnitt:
3.613 Mln.
Minimum:
640.0 Tsnd.
1 Jan 2007 Jahr
Maximum:
11.26 Mln.
1 Jan 2012 Jahr
Zum Datum der Beobachtung
Wert
Absolute Veränderung
Die Veränderung bezüglich dem vorherigen Wert
1 Jan 1994 Jahr
1.94 Mln.
+1.94 Mln.
0.0%
1 Jan 1995 Jahr
5.95 Mln.
+4.01 Mln.
206.7%
1 Jan 1996 Jahr
1.88 Mln.
-4.07 Mln.
-68.4%
1 Jan 1997 Jahr
2.35 Mln.
+470.0 Tsnd.
25.0%
1 Jan 1998 Jahr
2.94 Mln.
+590.0 Tsnd.
25.11%
1 Jan 1999 Jahr
3.27 Mln.
+330.0 Tsnd.
11.22%
1 Jan 2000 Jahr
3.87 Mln.
+600.0 Tsnd.
18.35%
1 Jan 2001 Jahr
3.72 Mln.
-150.0 Tsnd.
-3.88%
1 Jan 2002 Jahr
3.82 Mln.
+100.0 Tsnd.
2.69%
1 Jan 2003 Jahr
2.63 Mln.
-1.19 Mln.
-31.15%
1 Jan 2004 Jahr
3.52 Mln.
+890.0 Tsnd.
33.84%
1 Jan 2005 Jahr
2.71 Mln.
-810.0 Tsnd.
-23.01%
1 Jan 2006 Jahr
940.0 Tsnd.
-1.77 Mln.
-65.31%
1 Jan 2007 Jahr
640.0 Tsnd.
-300.0 Tsnd.
-31.91%
1 Jan 2008 Jahr
1.84 Mln.
+1.2 Mln.
187.5%
1 Jan 2009 Jahr
2.65 Mln.
+810.0 Tsnd.
44.02%
1 Jan 2010 Jahr
3.69 Mln.
+1.04 Mln.
39.25%
1 Jan 2011 Jahr
3.66 Mln.
-30.0 Tsnd.
-0.81%
1 Jan 2012 Jahr
11.26 Mln.
+7.6 Mln.
207.65%
1 Jan 2013 Jahr
9.89 Mln.
-1.37 Mln.
-12.17%
1 Jan 2014 Jahr
2.71 Mln.
-7.18 Mln.
-72.6%

Bewertung der Länder gemäß mit laufender Statistik nach Jahren