33
/de/
AIzaSyAYiBZKx7MnpbEhh9jyipgxe19OcubqV5w
August 1, 2025
80946
Belarus
BLR
true
2
1
Net official flows from UN agencies, UNHCR (current US$)
2011,2010,2009,2008,2007,2006,2005,2004,2003,2002,2001,2000,1999,1998,1997,1996
Download
Bibliothek der Globalstatistik →Belarus →

Net official flows from UN agencies, UNHCR (current US$)

Diese Statistik in anderen Ländern:

AfghanistanAlbaniaAlgeriaAngolaArab WorldArgentinaArmeniaAzerbaijanBahrainBangladeshBelarusBelizeBeninBoliviaBosnia and HerzegovinaBotswanaBrazilBulgariaBurkina FasoBurundiCabo VerdeCambodiaCameroonCaribbean small statesCentral African RepublicCentral Europe and the BalticsChadChileChinaColombiaComorosCongo, Dem. Rep.Congo, Rep.Costa RicaCote d'IvoireCroatiaCubaCyprusCzech RepublicDjiboutiDominican RepublicEast Asia & PacificEast Asia & Pacific (excluding high income)East Asia & Pacific (IDA & IBRD countries)EcuadorEgypt, Arab Rep.El SalvadorEquatorial GuineaEritreaEthiopiaEuro areaEurope & Central AsiaEurope & Central Asia (excluding high income)Europe & Central Asia (IDA & IBRD countries)European UnionFragile and conflict affected situationsGabonGambia, TheGeorgiaGhanaGuatemalaGuineaGuinea-BissauHaitiHeavily indebted poor countries (HIPC)High incomeHondurasHong Kong SAR, ChinaHungaryIBRD onlyIDA & IBRD totalIDA blendIDA onlyIDA totalIndiaIndonesiaIran, Islamic Rep.IraqIsraelJamaicaJordanKazakhstanKenyaKorea, Dem. People’s Rep.Korea, Rep.KosovoKuwaitKyrgyz RepublicLao PDRLatin America & Caribbean Latin America & Caribbean (excluding high income)Latin America & the Caribbean (IDA & IBRD countries)LatviaLeast developed countries: UN classificationLebanonLesothoLiberiaLibyaLow & middle incomeLow incomeLower middle incomeMacao SAR, ChinaMacedonia, FYRMadagascarMalawiMalaysiaMaliMaltaMauritaniaMexicoMiddle East & North AfricaMiddle East & North Africa (excluding high income)Middle East & North Africa (IDA & IBRD countries)Middle incomeMoldovaMongoliaMontenegroMoroccoMozambiqueMyanmarNamibiaNepalNicaraguaNigerNigeriaOECD membersOther small statesPakistanPanamaPapua New GuineaParaguayPeruPhilippinesPolandRomaniaRussian FederationRwandaSao Tome and PrincipeSaudi ArabiaSenegalSerbiaSierra LeoneSingaporeSlovak RepublicSloveniaSmall statesSomaliaSouth AfricaSouth AsiaSouth Asia (IDA & IBRD)South SudanSri LankaSub-Saharan Africa Sub-Saharan Africa (excluding high income)Sub-Saharan Africa (IDA & IBRD countries)SudanSurinameSwazilandSyrian Arab RepublicTajikistanTanzaniaThailandTimor-LesteTogoTunisiaTurkeyTurkmenistanUgandaUkraineUnited Arab EmiratesUpper middle incomeUruguayUzbekistanVenezuela, RBVietnamWorldYemen, Rep.ZambiaZimbabwe

Zeitlinie:

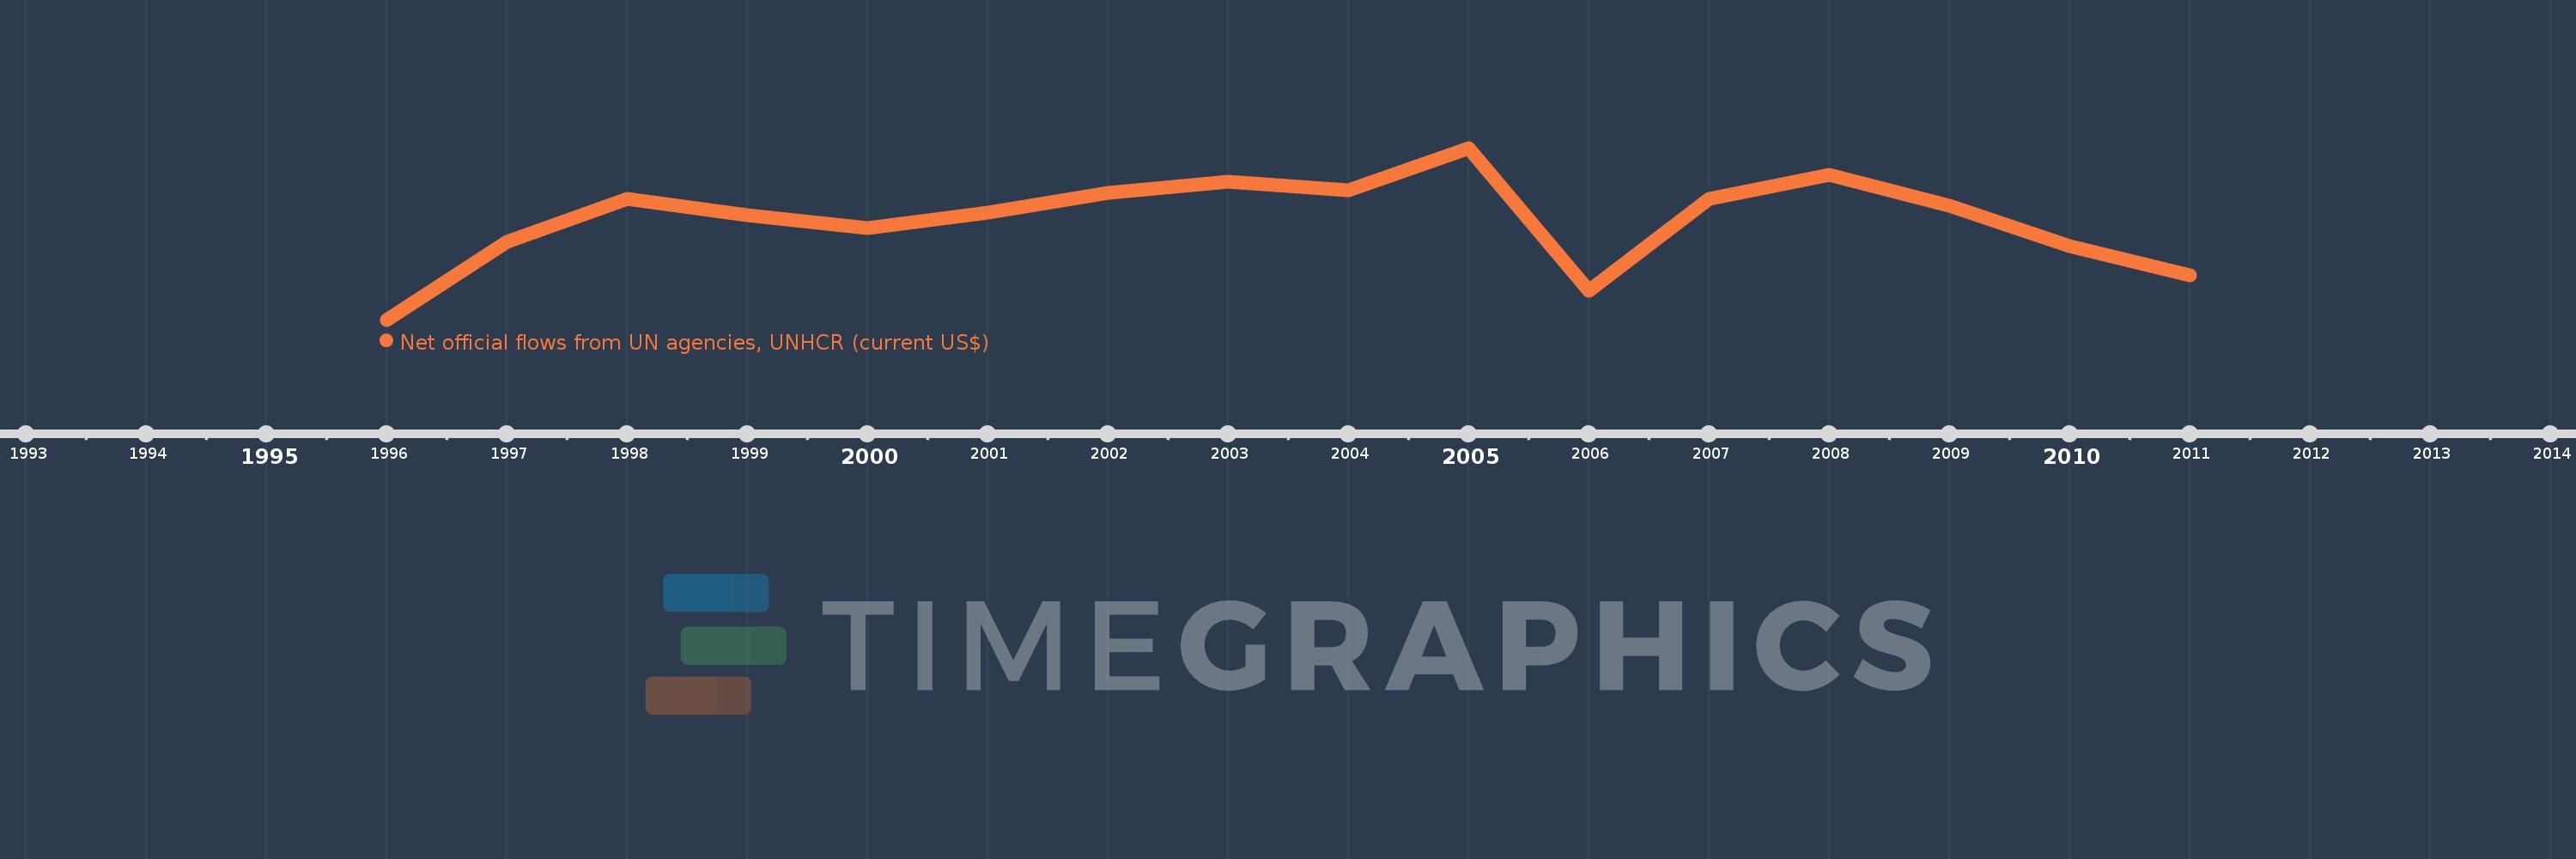
Diese Zeitleiste vorliegt die Graphik ab 1996 J. bis 2011 J. Belarus. Die Angaben bis 1995 J. sind nicht vorhanden. Die Zahl aktueller Beobachtungen nach Daten: 16.

Die Quelle (Bezeichnung):

Kennzahlen der Weltentwicklung

Die Quelle (Einrichtung):

Development Assistance Committee of the Organisation for Economic Co-operation and Development, Geographical Distribution of Financial Flows to Developing Countries, Development Co-operation Report, and International Development Statistics database. Data are available online at: www.oecd.org/dac/stats/idsonline.

Kategorien:

Aid Effectiveness

Es wurde aktualisiert:

23 Apr 2017 Jahr

Kennzahlen der Wertänderungen vom Jahr zum Jahr

im Durchschnitt:
556.875 Tsnd.
Minimum:
110.0 Tsnd.
1 Jan 1996 Jahr
Maximum:
880.0 Tsnd.
1 Jan 2005 Jahr
Zum Datum der Beobachtung
Wert
Absolute Veränderung
Die Veränderung bezüglich dem vorherigen Wert
1 Jan 1996 Jahr
110.0 Tsnd.
+110.0 Tsnd.
0.0%
1 Jan 1997 Jahr
460.0 Tsnd.
+350.0 Tsnd.
318.18%
1 Jan 1998 Jahr
650.0 Tsnd.
+190.0 Tsnd.
41.3%
1 Jan 1999 Jahr
580.0 Tsnd.
-70.0 Tsnd.
-10.77%
1 Jan 2000 Jahr
520.0 Tsnd.
-60.0 Tsnd.
-10.34%
1 Jan 2001 Jahr
590.0 Tsnd.
+70.0 Tsnd.
13.46%
1 Jan 2002 Jahr
680.0 Tsnd.
+90.0 Tsnd.
15.25%
1 Jan 2003 Jahr
730.0 Tsnd.
+50.0 Tsnd.
7.35%
1 Jan 2004 Jahr
690.0 Tsnd.
-40.0 Tsnd.
-5.48%
1 Jan 2005 Jahr
880.0 Tsnd.
+190.0 Tsnd.
27.54%
1 Jan 2006 Jahr
240.0 Tsnd.
-640.0 Tsnd.
-72.73%
1 Jan 2007 Jahr
650.0 Tsnd.
+410.0 Tsnd.
170.83%
1 Jan 2008 Jahr
760.0 Tsnd.
+110.0 Tsnd.
16.92%
1 Jan 2009 Jahr
620.0 Tsnd.
-140.0 Tsnd.
-18.42%
1 Jan 2010 Jahr
440.0 Tsnd.
-180.0 Tsnd.
-29.03%
1 Jan 2011 Jahr
310.0 Tsnd.
-130.0 Tsnd.
-29.55%

Bewertung der Länder gemäß mit laufender Statistik nach Jahren