33
/de/
AIzaSyAYiBZKx7MnpbEhh9jyipgxe19OcubqV5w
August 1, 2025
147191
Guinea-Bissau
GNB
true
2
1
Net official flows from UN agencies, UNHCR (current US$)
2014,2011,2004,2001,2000,1999,1998,1997,1996,1995,1994,1993,1992,1979,1978,1977,1976
Download
Bibliothek der Globalstatistik →Guinea-Bissau →

Net official flows from UN agencies, UNHCR (current US$)

Diese Statistik in anderen Ländern:

AfghanistanAlbaniaAlgeriaAngolaArab WorldArgentinaArmeniaAzerbaijanBahrainBangladeshBelarusBelizeBeninBoliviaBosnia and HerzegovinaBotswanaBrazilBulgariaBurkina FasoBurundiCabo VerdeCambodiaCameroonCaribbean small statesCentral African RepublicCentral Europe and the BalticsChadChileChinaColombiaComorosCongo, Dem. Rep.Congo, Rep.Costa RicaCote d'IvoireCroatiaCubaCyprusCzech RepublicDjiboutiDominican RepublicEast Asia & PacificEast Asia & Pacific (excluding high income)East Asia & Pacific (IDA & IBRD countries)EcuadorEgypt, Arab Rep.El SalvadorEquatorial GuineaEritreaEthiopiaEuro areaEurope & Central AsiaEurope & Central Asia (excluding high income)Europe & Central Asia (IDA & IBRD countries)European UnionFragile and conflict affected situationsGabonGambia, TheGeorgiaGhanaGuatemalaGuineaGuinea-BissauHaitiHeavily indebted poor countries (HIPC)High incomeHondurasHong Kong SAR, ChinaHungaryIBRD onlyIDA & IBRD totalIDA blendIDA onlyIDA totalIndiaIndonesiaIran, Islamic Rep.IraqIsraelJamaicaJordanKazakhstanKenyaKorea, Dem. People’s Rep.Korea, Rep.KosovoKuwaitKyrgyz RepublicLao PDRLatin America & Caribbean Latin America & Caribbean (excluding high income)Latin America & the Caribbean (IDA & IBRD countries)LatviaLeast developed countries: UN classificationLebanonLesothoLiberiaLibyaLow & middle incomeLow incomeLower middle incomeMacao SAR, ChinaMacedonia, FYRMadagascarMalawiMalaysiaMaliMaltaMauritaniaMexicoMiddle East & North AfricaMiddle East & North Africa (excluding high income)Middle East & North Africa (IDA & IBRD countries)Middle incomeMoldovaMongoliaMontenegroMoroccoMozambiqueMyanmarNamibiaNepalNicaraguaNigerNigeriaOECD membersOther small statesPakistanPanamaPapua New GuineaParaguayPeruPhilippinesPolandRomaniaRussian FederationRwandaSao Tome and PrincipeSaudi ArabiaSenegalSerbiaSierra LeoneSingaporeSlovak RepublicSloveniaSmall statesSomaliaSouth AfricaSouth AsiaSouth Asia (IDA & IBRD)South SudanSri LankaSub-Saharan Africa Sub-Saharan Africa (excluding high income)Sub-Saharan Africa (IDA & IBRD countries)SudanSurinameSwazilandSyrian Arab RepublicTajikistanTanzaniaThailandTimor-LesteTogoTunisiaTurkeyTurkmenistanUgandaUkraineUnited Arab EmiratesUpper middle incomeUruguayUzbekistanVenezuela, RBVietnamWorldYemen, Rep.ZambiaZimbabwe

Zeitlinie:

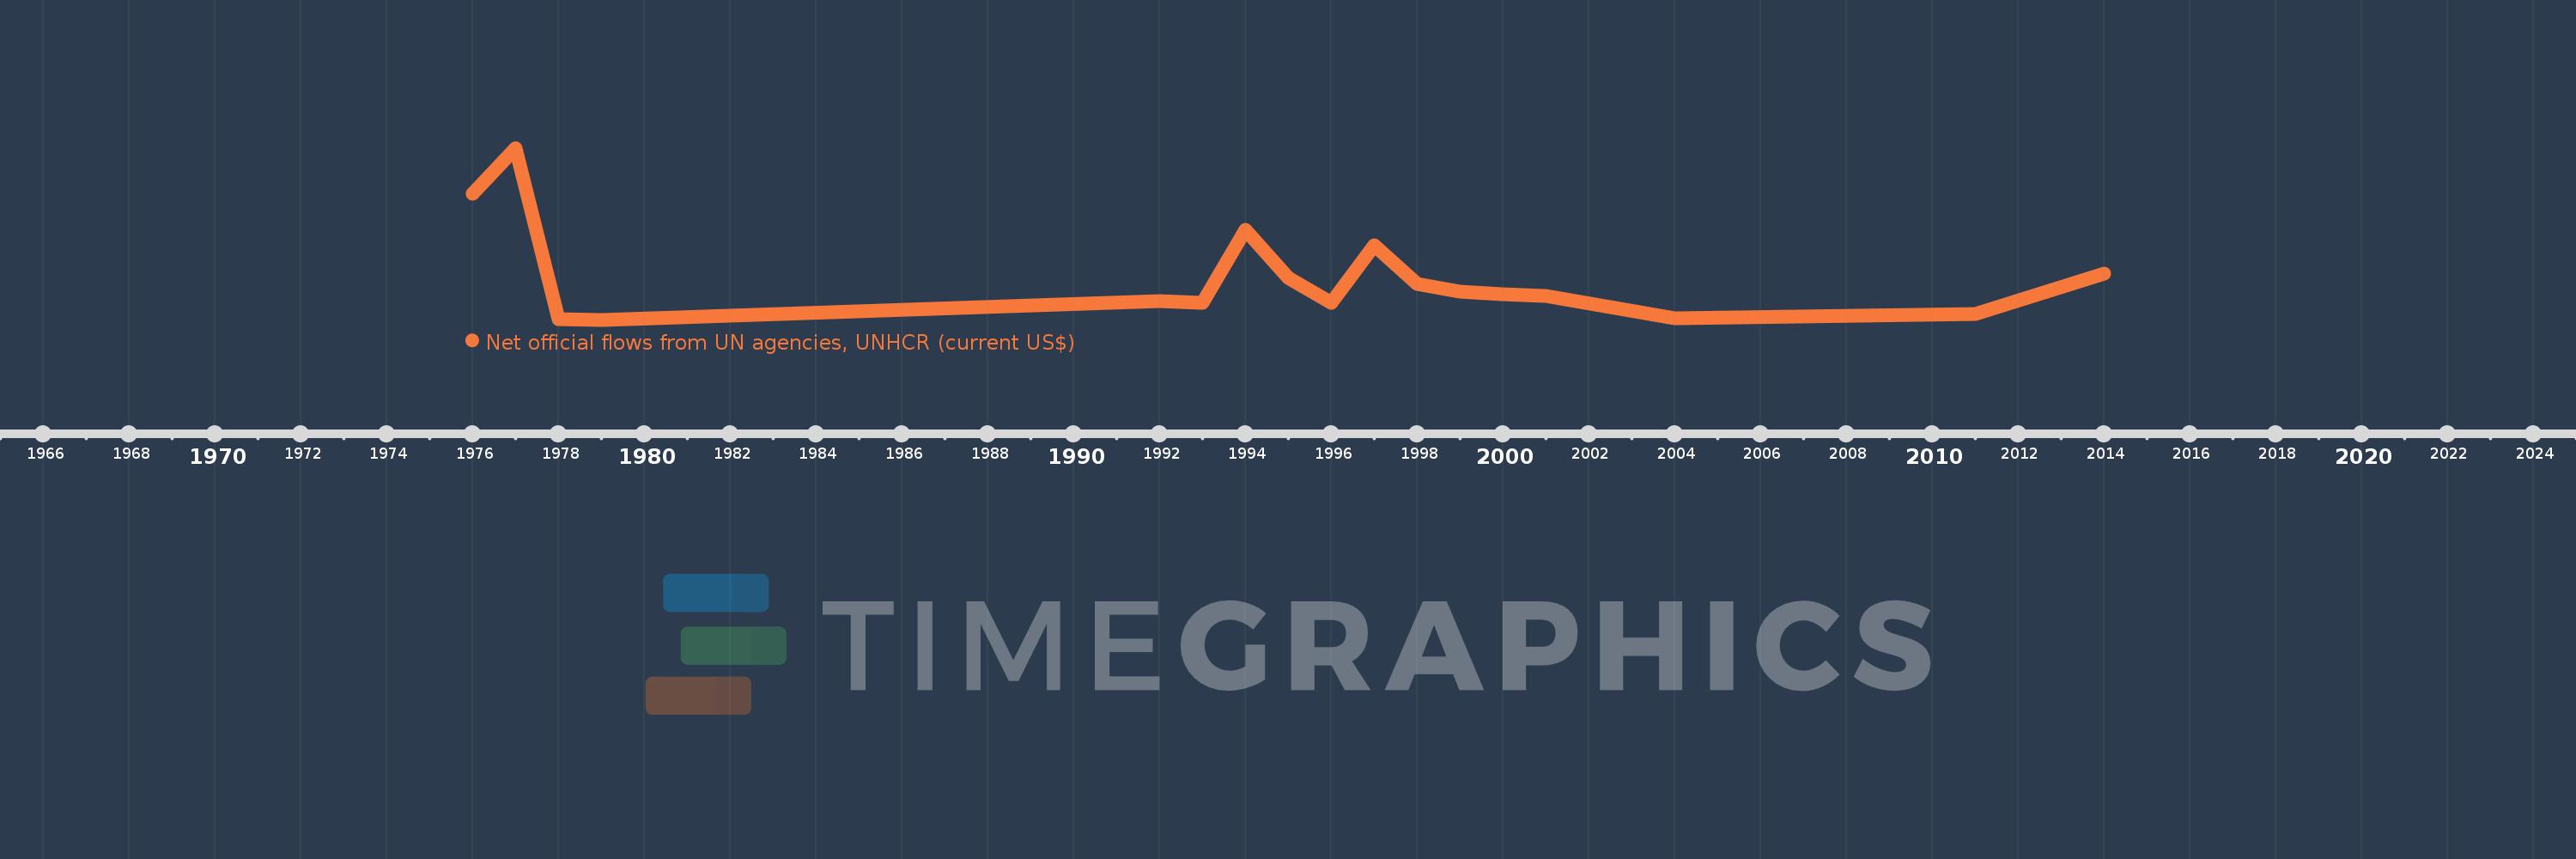
Diese Zeitleiste vorliegt die Graphik ab 1976 J. bis 2014 J. Guinea-Bissau. Die Angaben bis 1975 J. sind nicht vorhanden. Die Zahl aktueller Beobachtungen nach Daten: 17.

Die Quelle (Bezeichnung):

Kennzahlen der Weltentwicklung

Die Quelle (Einrichtung):

Development Assistance Committee of the Organisation for Economic Co-operation and Development, Geographical Distribution of Financial Flows to Developing Countries, Development Co-operation Report, and International Development Statistics database. Data are available online at: www.oecd.org/dac/stats/idsonline.

Kategorien:

Aid Effectiveness

Es wurde aktualisiert:

23 Apr 2017 Jahr

Kennzahlen der Wertänderungen vom Jahr zum Jahr

im Durchschnitt:
547.059 Tsnd.
Minimum:
10.0 Tsnd.
1 Jan 1979 Jahr
Maximum:
2.18 Mln.
1 Jan 1977 Jahr
Zum Datum der Beobachtung
Wert
Absolute Veränderung
Die Veränderung bezüglich dem vorherigen Wert
1 Jan 1976 Jahr
1.6 Mln.
+1.6 Mln.
0.0%
1 Jan 1977 Jahr
2.18 Mln.
+580.0 Tsnd.
36.25%
1 Jan 1978 Jahr
20.0 Tsnd.
-2.16 Mln.
-99.08%
1 Jan 1979 Jahr
10.0 Tsnd.
-10.0 Tsnd.
-50.0%
1 Jan 1992 Jahr
250.0 Tsnd.
+240.0 Tsnd.
2.4 Tsnd.%
1 Jan 1993 Jahr
220.0 Tsnd.
-30.0 Tsnd.
-12.0%
1 Jan 1994 Jahr
1.15 Mln.
+930.0 Tsnd.
422.73%
1 Jan 1995 Jahr
540.0 Tsnd.
-610.0 Tsnd.
-53.04%
1 Jan 1996 Jahr
220.0 Tsnd.
-320.0 Tsnd.
-59.26%
1 Jan 1997 Jahr
950.0 Tsnd.
+730.0 Tsnd.
331.82%
1 Jan 1998 Jahr
460.0 Tsnd.
-490.0 Tsnd.
-51.58%
1 Jan 1999 Jahr
360.0 Tsnd.
-100.0 Tsnd.
-21.74%
1 Jan 2000 Jahr
330.0 Tsnd.
-30.0 Tsnd.
-8.33%
1 Jan 2001 Jahr
310.0 Tsnd.
-20.0 Tsnd.
-6.06%
1 Jan 2004 Jahr
30.0 Tsnd.
-280.0 Tsnd.
-90.32%
1 Jan 2011 Jahr
80.0 Tsnd.
+50.0 Tsnd.
166.67%
1 Jan 2014 Jahr
590.0 Tsnd.
+510.0 Tsnd.
637.5%

Bewertung der Länder gemäß mit laufender Statistik nach Jahren