33
/de/
AIzaSyAYiBZKx7MnpbEhh9jyipgxe19OcubqV5w
August 1, 2025
170302
Korea, Rep.
KOR
true
2
1
Net official flows from UN agencies, UNHCR (current US$)
2003,2002,1994,1993,1992,1991,1990,1989,1987,1986,1985,1984,1983,1982,1981,1980
Download
Bibliothek der Globalstatistik →Korea, Rep. →

Net official flows from UN agencies, UNHCR (current US$)

Diese Statistik in anderen Ländern:

AfghanistanAlbaniaAlgeriaAngolaArab WorldArgentinaArmeniaAzerbaijanBahrainBangladeshBelarusBelizeBeninBoliviaBosnia and HerzegovinaBotswanaBrazilBulgariaBurkina FasoBurundiCabo VerdeCambodiaCameroonCaribbean small statesCentral African RepublicCentral Europe and the BalticsChadChileChinaColombiaComorosCongo, Dem. Rep.Congo, Rep.Costa RicaCote d'IvoireCroatiaCubaCyprusCzech RepublicDjiboutiDominican RepublicEast Asia & PacificEast Asia & Pacific (excluding high income)East Asia & Pacific (IDA & IBRD countries)EcuadorEgypt, Arab Rep.El SalvadorEquatorial GuineaEritreaEthiopiaEuro areaEurope & Central AsiaEurope & Central Asia (excluding high income)Europe & Central Asia (IDA & IBRD countries)European UnionFragile and conflict affected situationsGabonGambia, TheGeorgiaGhanaGuatemalaGuineaGuinea-BissauHaitiHeavily indebted poor countries (HIPC)High incomeHondurasHong Kong SAR, ChinaHungaryIBRD onlyIDA & IBRD totalIDA blendIDA onlyIDA totalIndiaIndonesiaIran, Islamic Rep.IraqIsraelJamaicaJordanKazakhstanKenyaKorea, Dem. People’s Rep.Korea, Rep.KosovoKuwaitKyrgyz RepublicLao PDRLatin America & Caribbean Latin America & Caribbean (excluding high income)Latin America & the Caribbean (IDA & IBRD countries)LatviaLeast developed countries: UN classificationLebanonLesothoLiberiaLibyaLow & middle incomeLow incomeLower middle incomeMacao SAR, ChinaMacedonia, FYRMadagascarMalawiMalaysiaMaliMaltaMauritaniaMexicoMiddle East & North AfricaMiddle East & North Africa (excluding high income)Middle East & North Africa (IDA & IBRD countries)Middle incomeMoldovaMongoliaMontenegroMoroccoMozambiqueMyanmarNamibiaNepalNicaraguaNigerNigeriaOECD membersOther small statesPakistanPanamaPapua New GuineaParaguayPeruPhilippinesPolandRomaniaRussian FederationRwandaSao Tome and PrincipeSaudi ArabiaSenegalSerbiaSierra LeoneSingaporeSlovak RepublicSloveniaSmall statesSomaliaSouth AfricaSouth AsiaSouth Asia (IDA & IBRD)South SudanSri LankaSub-Saharan Africa Sub-Saharan Africa (excluding high income)Sub-Saharan Africa (IDA & IBRD countries)SudanSurinameSwazilandSyrian Arab RepublicTajikistanTanzaniaThailandTimor-LesteTogoTunisiaTurkeyTurkmenistanUgandaUkraineUnited Arab EmiratesUpper middle incomeUruguayUzbekistanVenezuela, RBVietnamWorldYemen, Rep.ZambiaZimbabwe

Zeitlinie:

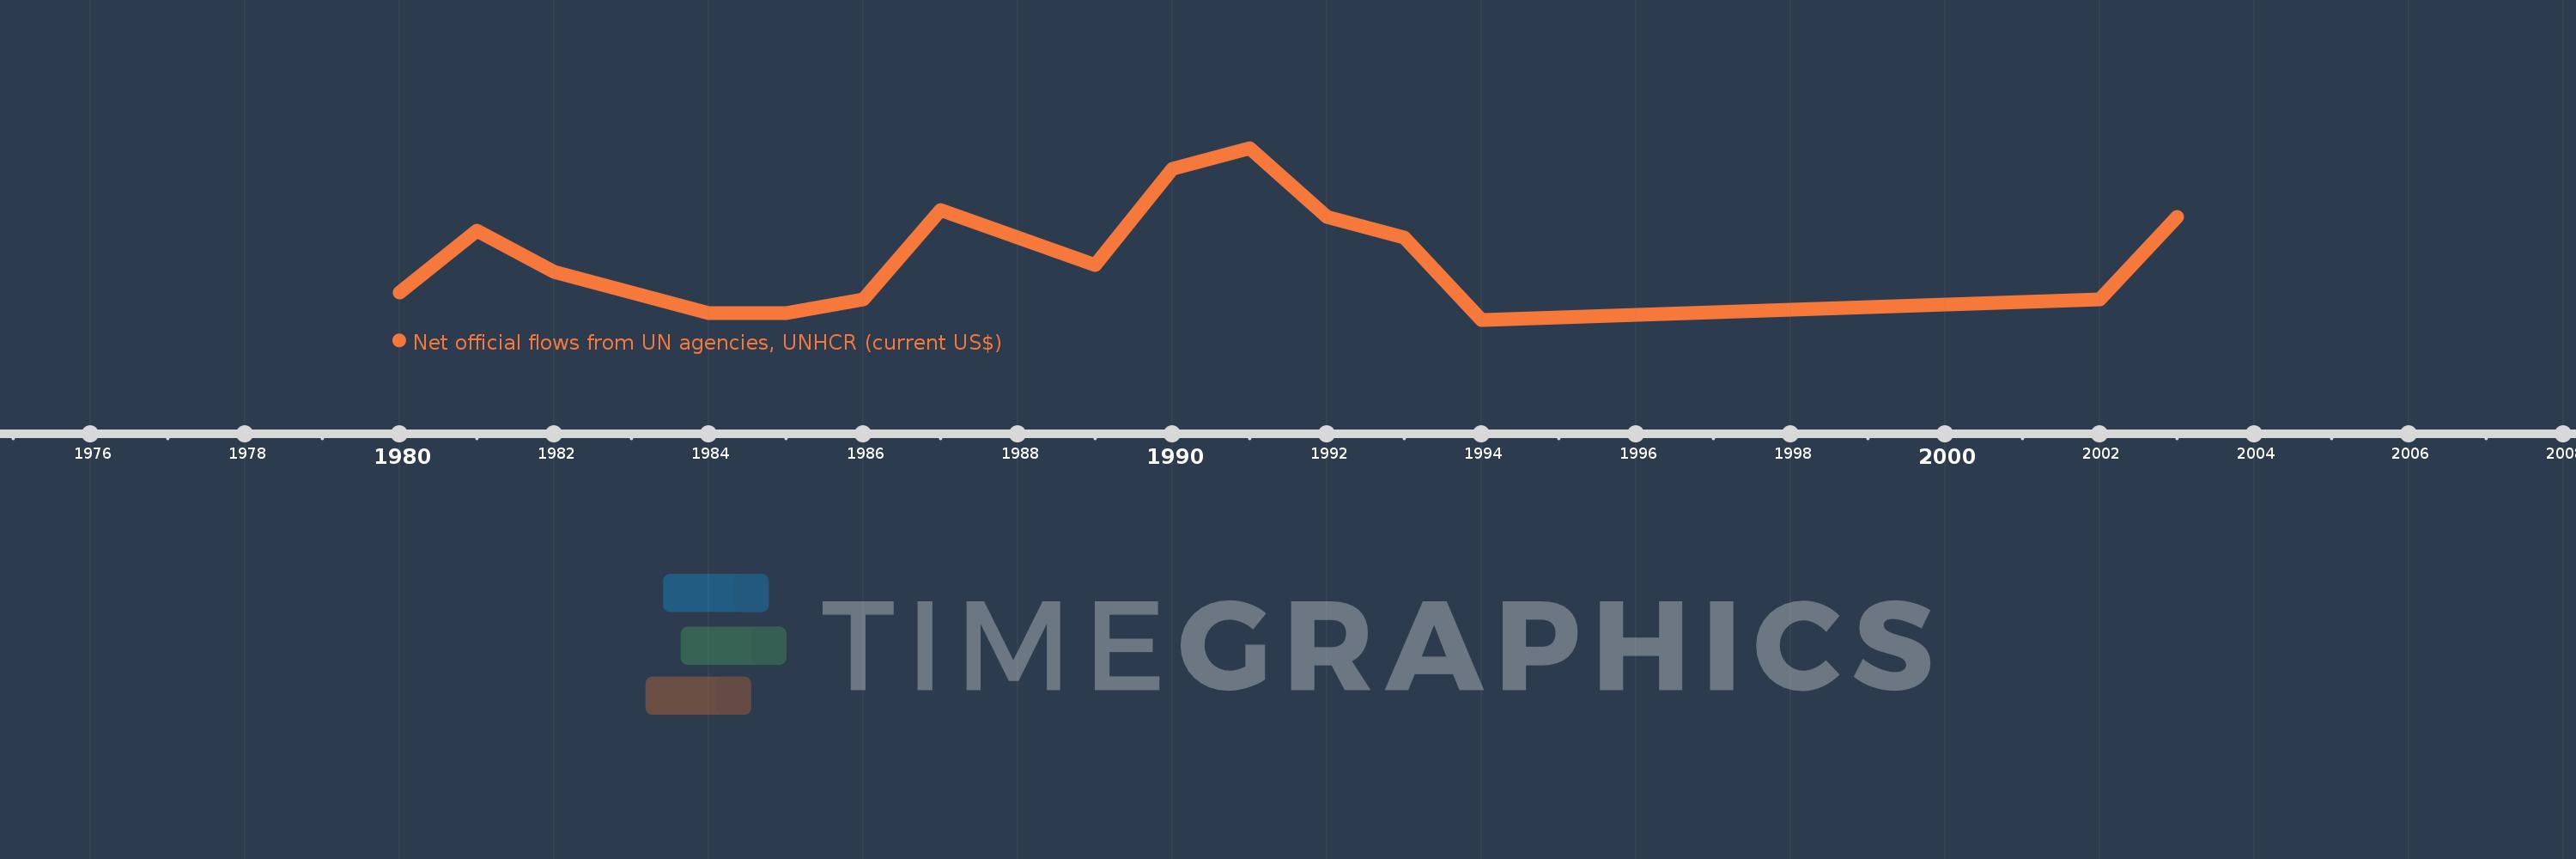
Diese Zeitleiste vorliegt die Graphik ab 1980 J. bis 2003 J. Korea, Rep.. Die Angaben bis 1979 J. sind nicht vorhanden. Die Zahl aktueller Beobachtungen nach Daten: 16.

Die Quelle (Bezeichnung):

Kennzahlen der Weltentwicklung

Die Quelle (Einrichtung):

Development Assistance Committee of the Organisation for Economic Co-operation and Development, Geographical Distribution of Financial Flows to Developing Countries, Development Co-operation Report, and International Development Statistics database. Data are available online at: www.oecd.org/dac/stats/idsonline.

Kategorien:

Aid Effectiveness

Es wurde aktualisiert:

23 Apr 2017 Jahr

Kennzahlen der Wertänderungen vom Jahr zum Jahr

im Durchschnitt:
133.125 Tsnd.
Minimum:
40.0 Tsnd.
1 Jan 1994 Jahr
Maximum:
290.0 Tsnd.
1 Jan 1991 Jahr
Zum Datum der Beobachtung
Wert
Absolute Veränderung
Die Veränderung bezüglich dem vorherigen Wert
1 Jan 1980 Jahr
80.0 Tsnd.
+80.0 Tsnd.
0.0%
1 Jan 1981 Jahr
170.0 Tsnd.
+90.0 Tsnd.
112.5%
1 Jan 1982 Jahr
110.0 Tsnd.
-60.0 Tsnd.
-35.29%
1 Jan 1983 Jahr
80.0 Tsnd.
-30.0 Tsnd.
-27.27%
1 Jan 1984 Jahr
50.0 Tsnd.
-30.0 Tsnd.
-37.5%
1 Jan 1985 Jahr
50.0 Tsnd.
0.0
0.0%
1 Jan 1986 Jahr
70.0 Tsnd.
+20.0 Tsnd.
40.0%
1 Jan 1987 Jahr
200.0 Tsnd.
+130.0 Tsnd.
185.71%
1 Jan 1989 Jahr
120.0 Tsnd.
-80.0 Tsnd.
-40.0%
1 Jan 1990 Jahr
260.0 Tsnd.
+140.0 Tsnd.
116.67%
1 Jan 1991 Jahr
290.0 Tsnd.
+30.0 Tsnd.
11.54%
1 Jan 1992 Jahr
190.0 Tsnd.
-100.0 Tsnd.
-34.48%
1 Jan 1993 Jahr
160.0 Tsnd.
-30.0 Tsnd.
-15.79%
1 Jan 1994 Jahr
40.0 Tsnd.
-120.0 Tsnd.
-75.0%
1 Jan 2002 Jahr
70.0 Tsnd.
+30.0 Tsnd.
75.0%
1 Jan 2003 Jahr
190.0 Tsnd.
+120.0 Tsnd.
171.43%

Bewertung der Länder gemäß mit laufender Statistik nach Jahren