29
/de/
de
AIzaSyAYiBZKx7MnpbEhh9jyipgxe19OcubqV5w
April 1, 2024
107667
Colombia
COL
true
2
1
Net official flows from UN agencies, UNHCR (current US$)
2011,2010,2009,2008,2007,2004,2003,2002,2001,2000,1999,1997,1996,1995,1994,1993,1992,1991
Download
Bibliothek der Globalstatistik →Colombia →

Net official flows from UN agencies, UNHCR (current US$)

Diese Statistik in anderen Ländern:
AfghanistanAlbaniaAlgeriaAngolaArab WorldArgentinaArmeniaAzerbaijanBahrainBangladeshBelarusBelizeBeninBoliviaBosnia and HerzegovinaBotswanaBrazilBulgariaBurkina FasoBurundiCabo VerdeCambodiaCameroonCaribbean small statesCentral African RepublicCentral Europe and the BalticsChadChileChinaColombiaComorosCongo, Dem. Rep.Congo, Rep.Costa RicaCote d'IvoireCroatiaCubaCyprusCzech RepublicDjiboutiDominican RepublicEast Asia & PacificEast Asia & Pacific (excluding high income)East Asia & Pacific (IDA & IBRD countries)EcuadorEgypt, Arab Rep.El SalvadorEquatorial GuineaEritreaEthiopiaEuro areaEurope & Central AsiaEurope & Central Asia (excluding high income)Europe & Central Asia (IDA & IBRD countries)European UnionFragile and conflict affected situationsGabonGambia, TheGeorgiaGhanaGuatemalaGuineaGuinea-BissauHaitiHeavily indebted poor countries (HIPC)High incomeHondurasHong Kong SAR, ChinaHungaryIBRD onlyIDA & IBRD totalIDA blendIDA onlyIDA totalIndiaIndonesiaIran, Islamic Rep.IraqIsraelJamaicaJordanKazakhstanKenyaKorea, Dem. People’s Rep.Korea, Rep.KosovoKuwaitKyrgyz RepublicLao PDRLatin America & Caribbean Latin America & Caribbean (excluding high income)Latin America & the Caribbean (IDA & IBRD countries)LatviaLeast developed countries: UN classificationLebanonLesothoLiberiaLibyaLow & middle incomeLow incomeLower middle incomeMacao SAR, ChinaMacedonia, FYRMadagascarMalawiMalaysiaMaliMaltaMauritaniaMexicoMiddle East & North AfricaMiddle East & North Africa (excluding high income)Middle East & North Africa (IDA & IBRD countries)Middle incomeMoldovaMongoliaMontenegroMoroccoMozambiqueMyanmarNamibiaNepalNicaraguaNigerNigeriaOECD membersOther small statesPakistanPanamaPapua New GuineaParaguayPeruPhilippinesPolandRomaniaRussian FederationRwandaSao Tome and PrincipeSaudi ArabiaSenegalSerbiaSierra LeoneSingaporeSlovak RepublicSloveniaSmall statesSomaliaSouth AfricaSouth AsiaSouth Asia (IDA & IBRD)South SudanSri LankaSub-Saharan Africa Sub-Saharan Africa (excluding high income)Sub-Saharan Africa (IDA & IBRD countries)SudanSurinameSwazilandSyrian Arab RepublicTajikistanTanzaniaThailandTimor-LesteTogoTunisiaTurkeyTurkmenistanUgandaUkraineUnited Arab EmiratesUpper middle incomeUruguayUzbekistanVenezuela, RBVietnamWorldYemen, Rep.ZambiaZimbabwe
Zeitlinie:
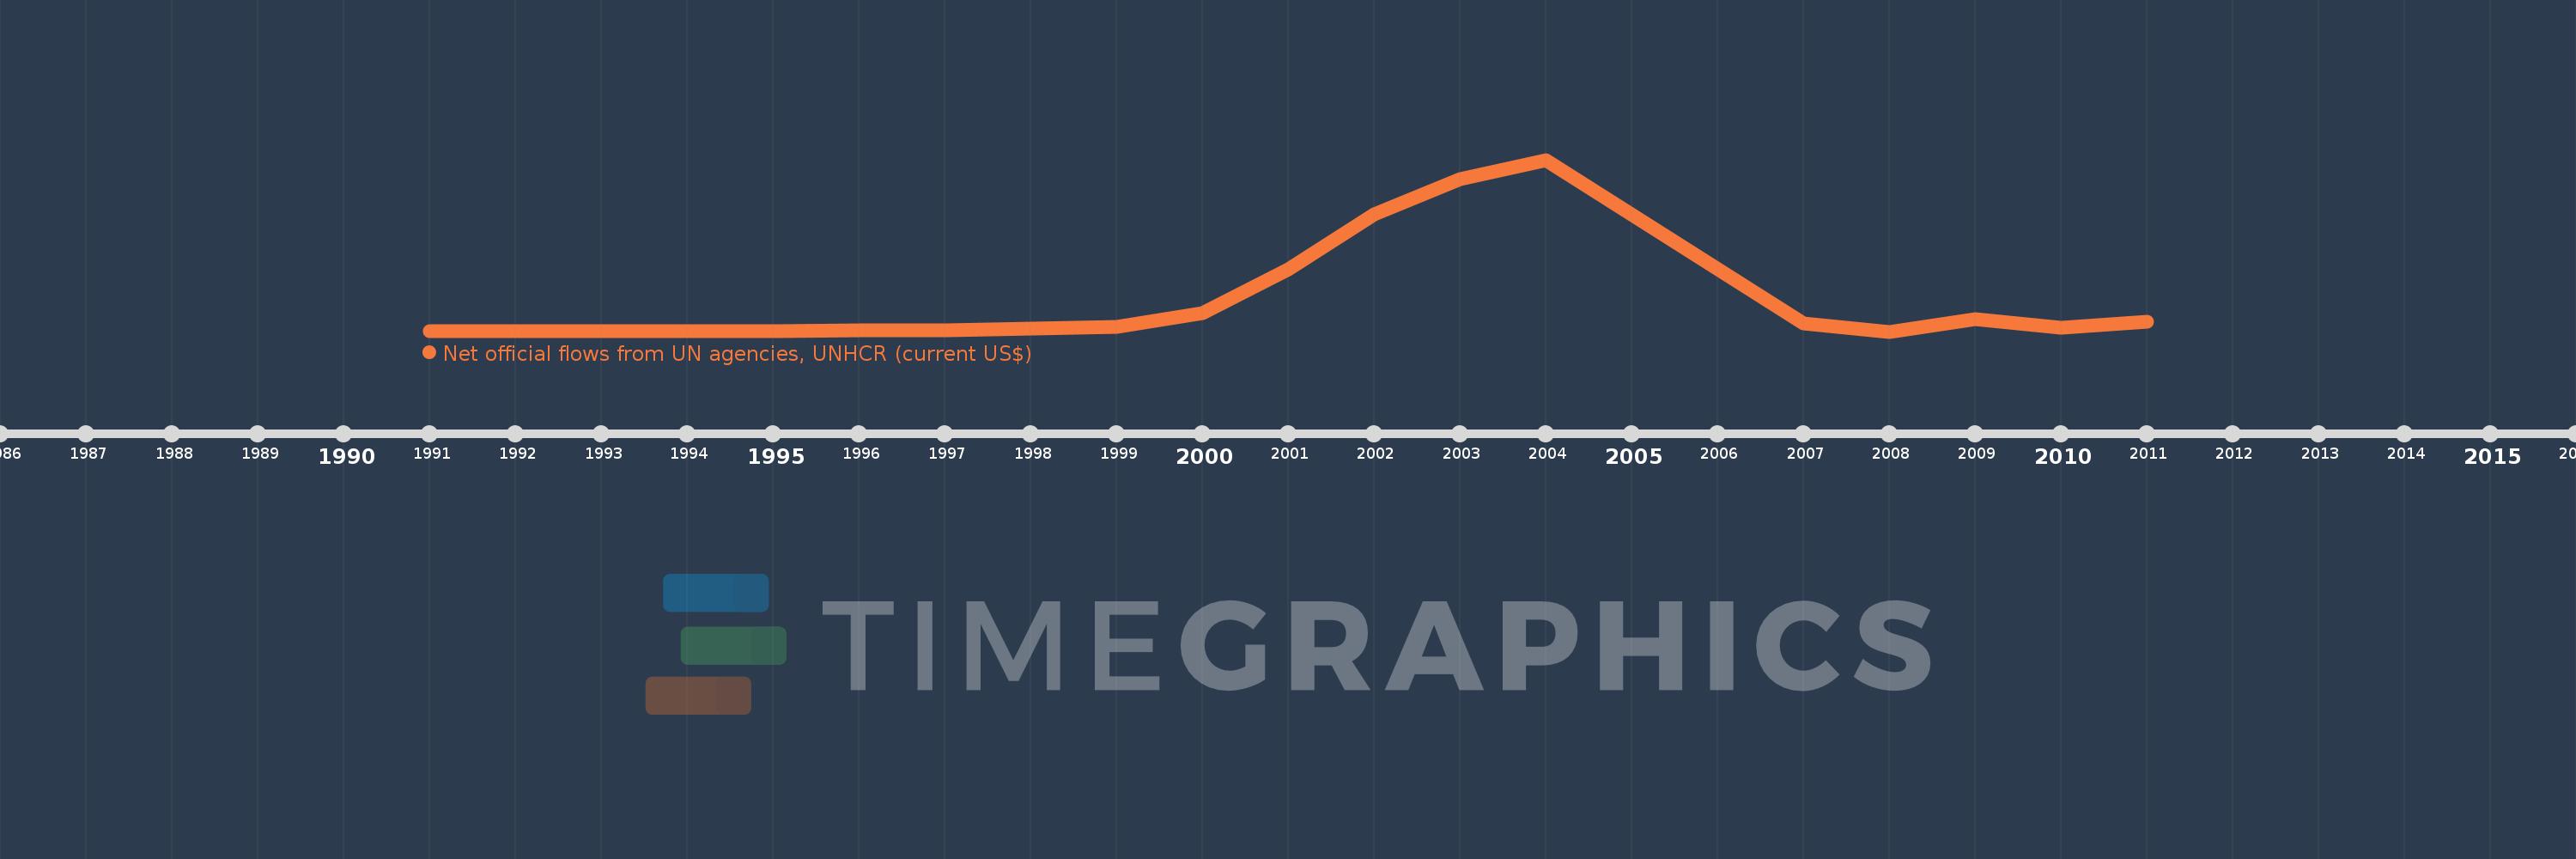
Diese Zeitleiste vorliegt die Graphik ab 1991 J. bis 2011 J. Colombia. Die Angaben bis 1990 J. sind nicht vorhanden. Die Zahl aktueller Beobachtungen nach Daten: 18.
Die Quelle (Bezeichnung):
Kennzahlen der Weltentwicklung
Die Quelle (Einrichtung):
Development Assistance Committee of the Organisation for Economic Co-operation and Development, Geographical Distribution of Financial Flows to Developing Countries, Development Co-operation Report, and International Development Statistics database. Data are available online at: www.oecd.org/dac/stats/idsonline.
Kategorien:
Aid Effectiveness
Es wurde aktualisiert:
23 Apr 2017 Jahr
Kennzahlen der Wertänderungen vom Jahr zum Jahr
im Durchschnitt:
904.444 Tsnd.
Minimum:
20.0 Tsnd.
1 Jan 2008 Jahr
Maximum:
4.85 Mln.
1 Jan 2004 Jahr
Zum Datum der Beobachtung
Wert
Absolute Veränderung
Die Veränderung bezüglich dem vorherigen Wert
1 Jan 1991 Jahr
40.0 Tsnd.
+40.0 Tsnd.
0.0%
1 Jan 1992 Jahr
40.0 Tsnd.
0.0
0.0%
1 Jan 1993 Jahr
30.0 Tsnd.
-10.0 Tsnd.
-25.0%
1 Jan 1994 Jahr
40.0 Tsnd.
+10.0 Tsnd.
33.33%
1 Jan 1995 Jahr
40.0 Tsnd.
0.0
0.0%
1 Jan 1996 Jahr
50.0 Tsnd.
+10.0 Tsnd.
25.0%
1 Jan 1997 Jahr
50.0 Tsnd.
0.0
0.0%
1 Jan 1999 Jahr
160.0 Tsnd.
+110.0 Tsnd.
220.0%
1 Jan 2000 Jahr
550.0 Tsnd.
+390.0 Tsnd.
243.75%
1 Jan 2001 Jahr
1.76 Mln.
+1.21 Mln.
220.0%
1 Jan 2002 Jahr
3.32 Mln.
+1.56 Mln.
88.64%
1 Jan 2003 Jahr
4.31 Mln.
+990.0 Tsnd.
29.82%
1 Jan 2004 Jahr
4.85 Mln.
+540.0 Tsnd.
12.53%
1 Jan 2007 Jahr
240.0 Tsnd.
-4.61 Mln.
-95.05%
1 Jan 2008 Jahr
20.0 Tsnd.
-220.0 Tsnd.
-91.67%
1 Jan 2009 Jahr
370.0 Tsnd.
+350.0 Tsnd.
1.75 Tsnd.%
1 Jan 2010 Jahr
120.0 Tsnd.
-250.0 Tsnd.
-67.57%
1 Jan 2011 Jahr
290.0 Tsnd.
+170.0 Tsnd.
141.67%
Bewertung der Länder gemäß mit laufender Statistik nach Jahren

Kommentare:

Abschicken
PremiumAbout & FeedbackVereinbarungPrivatheit
logo
© 2022 Selected Technologies LLC – Morgan Hill, California