33
/de/
AIzaSyAYiBZKx7MnpbEhh9jyipgxe19OcubqV5w
August 1, 2025
158764
Iraq
IRQ
true
2
1
Net official flows from UN agencies, UNHCR (current US$)
2011,2010,2009,2008,2007,2005,2004,2003,2002,2001,2000,1999,1998,1997,1996,1995,1994,1993,1992,1991
Download
Bibliothek der Globalstatistik →Iraq →

Net official flows from UN agencies, UNHCR (current US$)

Diese Statistik in anderen Ländern:

AfghanistanAlbaniaAlgeriaAngolaArab WorldArgentinaArmeniaAzerbaijanBahrainBangladeshBelarusBelizeBeninBoliviaBosnia and HerzegovinaBotswanaBrazilBulgariaBurkina FasoBurundiCabo VerdeCambodiaCameroonCaribbean small statesCentral African RepublicCentral Europe and the BalticsChadChileChinaColombiaComorosCongo, Dem. Rep.Congo, Rep.Costa RicaCote d'IvoireCroatiaCubaCyprusCzech RepublicDjiboutiDominican RepublicEast Asia & PacificEast Asia & Pacific (excluding high income)East Asia & Pacific (IDA & IBRD countries)EcuadorEgypt, Arab Rep.El SalvadorEquatorial GuineaEritreaEthiopiaEuro areaEurope & Central AsiaEurope & Central Asia (excluding high income)Europe & Central Asia (IDA & IBRD countries)European UnionFragile and conflict affected situationsGabonGambia, TheGeorgiaGhanaGuatemalaGuineaGuinea-BissauHaitiHeavily indebted poor countries (HIPC)High incomeHondurasHong Kong SAR, ChinaHungaryIBRD onlyIDA & IBRD totalIDA blendIDA onlyIDA totalIndiaIndonesiaIran, Islamic Rep.IraqIsraelJamaicaJordanKazakhstanKenyaKorea, Dem. People’s Rep.Korea, Rep.KosovoKuwaitKyrgyz RepublicLao PDRLatin America & Caribbean Latin America & Caribbean (excluding high income)Latin America & the Caribbean (IDA & IBRD countries)LatviaLeast developed countries: UN classificationLebanonLesothoLiberiaLibyaLow & middle incomeLow incomeLower middle incomeMacao SAR, ChinaMacedonia, FYRMadagascarMalawiMalaysiaMaliMaltaMauritaniaMexicoMiddle East & North AfricaMiddle East & North Africa (excluding high income)Middle East & North Africa (IDA & IBRD countries)Middle incomeMoldovaMongoliaMontenegroMoroccoMozambiqueMyanmarNamibiaNepalNicaraguaNigerNigeriaOECD membersOther small statesPakistanPanamaPapua New GuineaParaguayPeruPhilippinesPolandRomaniaRussian FederationRwandaSao Tome and PrincipeSaudi ArabiaSenegalSerbiaSierra LeoneSingaporeSlovak RepublicSloveniaSmall statesSomaliaSouth AfricaSouth AsiaSouth Asia (IDA & IBRD)South SudanSri LankaSub-Saharan Africa Sub-Saharan Africa (excluding high income)Sub-Saharan Africa (IDA & IBRD countries)SudanSurinameSwazilandSyrian Arab RepublicTajikistanTanzaniaThailandTimor-LesteTogoTunisiaTurkeyTurkmenistanUgandaUkraineUnited Arab EmiratesUpper middle incomeUruguayUzbekistanVenezuela, RBVietnamWorldYemen, Rep.ZambiaZimbabwe

Zeitlinie:

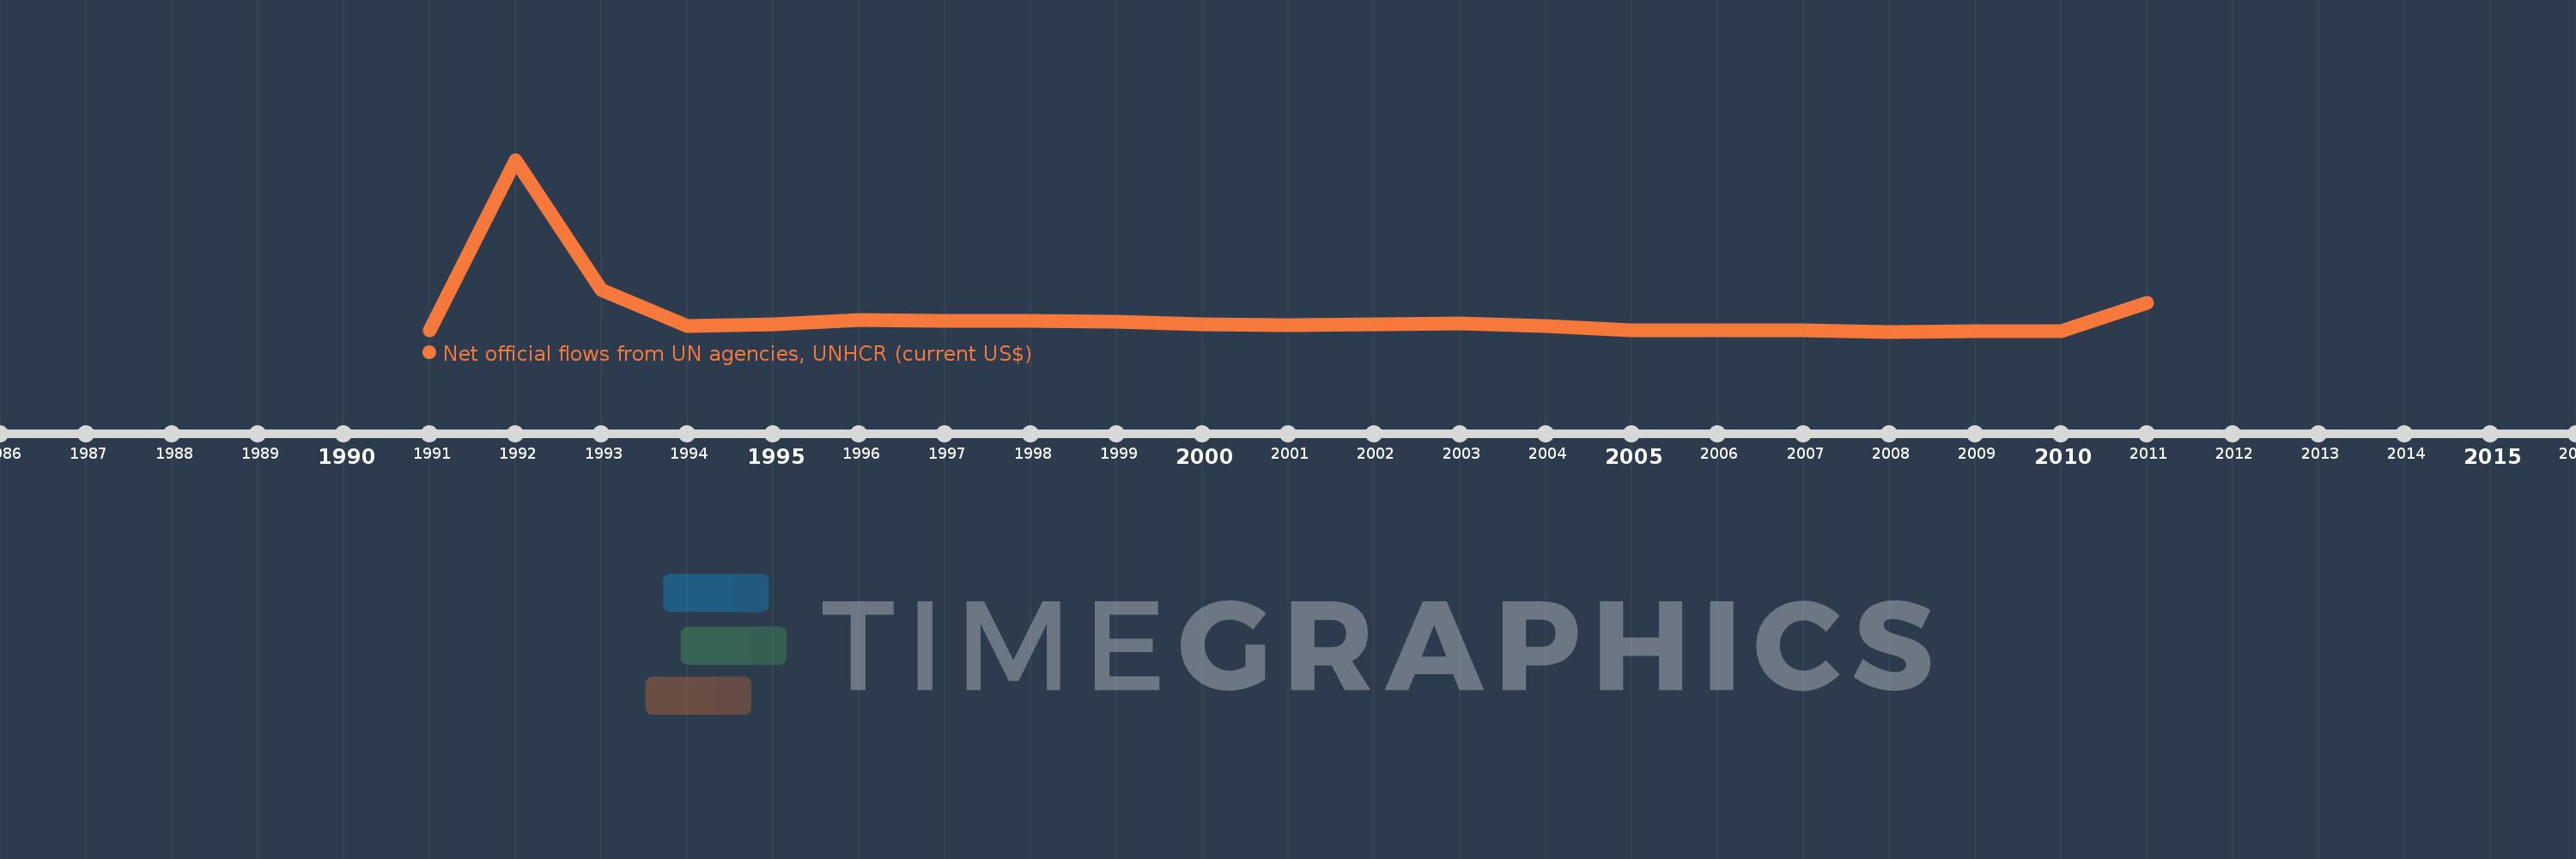
Diese Zeitleiste vorliegt die Graphik ab 1991 J. bis 2011 J. Iraq. Die Angaben bis 1990 J. sind nicht vorhanden. Die Zahl aktueller Beobachtungen nach Daten: 20.

Die Quelle (Bezeichnung):

Kennzahlen der Weltentwicklung

Die Quelle (Einrichtung):

Development Assistance Committee of the Organisation for Economic Co-operation and Development, Geographical Distribution of Financial Flows to Developing Countries, Development Co-operation Report, and International Development Statistics database. Data are available online at: www.oecd.org/dac/stats/idsonline.

Kategorien:

Aid Effectiveness

Es wurde aktualisiert:

23 Apr 2017 Jahr

Kennzahlen der Wertänderungen vom Jahr zum Jahr

im Durchschnitt:
6.434 Mln.
Minimum:
90.0 Tsnd.
1 Jan 2008 Jahr
Maximum:
64.79 Mln.
1 Jan 1992 Jahr
Zum Datum der Beobachtung
Wert
Absolute Veränderung
Die Veränderung bezüglich dem vorherigen Wert
1 Jan 1991 Jahr
520.0 Tsnd.
+520.0 Tsnd.
0.0%
1 Jan 1992 Jahr
64.79 Mln.
+64.27 Mln.
12.36 Tsnd.%
1 Jan 1993 Jahr
15.84 Mln.
-48.95 Mln.
-75.55%
1 Jan 1994 Jahr
2.19 Mln.
-13.65 Mln.
-86.17%
1 Jan 1995 Jahr
2.94 Mln.
+750.0 Tsnd.
34.25%
1 Jan 1996 Jahr
4.51 Mln.
+1.57 Mln.
53.4%
1 Jan 1997 Jahr
4.02 Mln.
-490.0 Tsnd.
-10.86%
1 Jan 1998 Jahr
4.21 Mln.
+190.0 Tsnd.
4.73%
1 Jan 1999 Jahr
3.7 Mln.
-510.0 Tsnd.
-12.11%
1 Jan 2000 Jahr
2.92 Mln.
-780.0 Tsnd.
-21.08%
1 Jan 2001 Jahr
2.56 Mln.
-360.0 Tsnd.
-12.33%
1 Jan 2002 Jahr
2.74 Mln.
+180.0 Tsnd.
7.03%
1 Jan 2003 Jahr
3.17 Mln.
+430.0 Tsnd.
15.69%
1 Jan 2004 Jahr
2.12 Mln.
-1.05 Mln.
-33.12%
1 Jan 2005 Jahr
430.0 Tsnd.
-1.69 Mln.
-79.72%
1 Jan 2007 Jahr
590.0 Tsnd.
+160.0 Tsnd.
37.21%
1 Jan 2008 Jahr
90.0 Tsnd.
-500.0 Tsnd.
-84.75%
1 Jan 2009 Jahr
160.0 Tsnd.
+70.0 Tsnd.
77.78%
1 Jan 2010 Jahr
340.0 Tsnd.
+180.0 Tsnd.
112.5%
1 Jan 2011 Jahr
10.84 Mln.
+10.5 Mln.
3.09 Tsnd.%

Bewertung der Länder gemäß mit laufender Statistik nach Jahren