29
/
en
AIzaSyAYiBZKx7MnpbEhh9jyipgxe19OcubqV5w
April 1, 2024
96840
Burundi
BDI
true
2
1
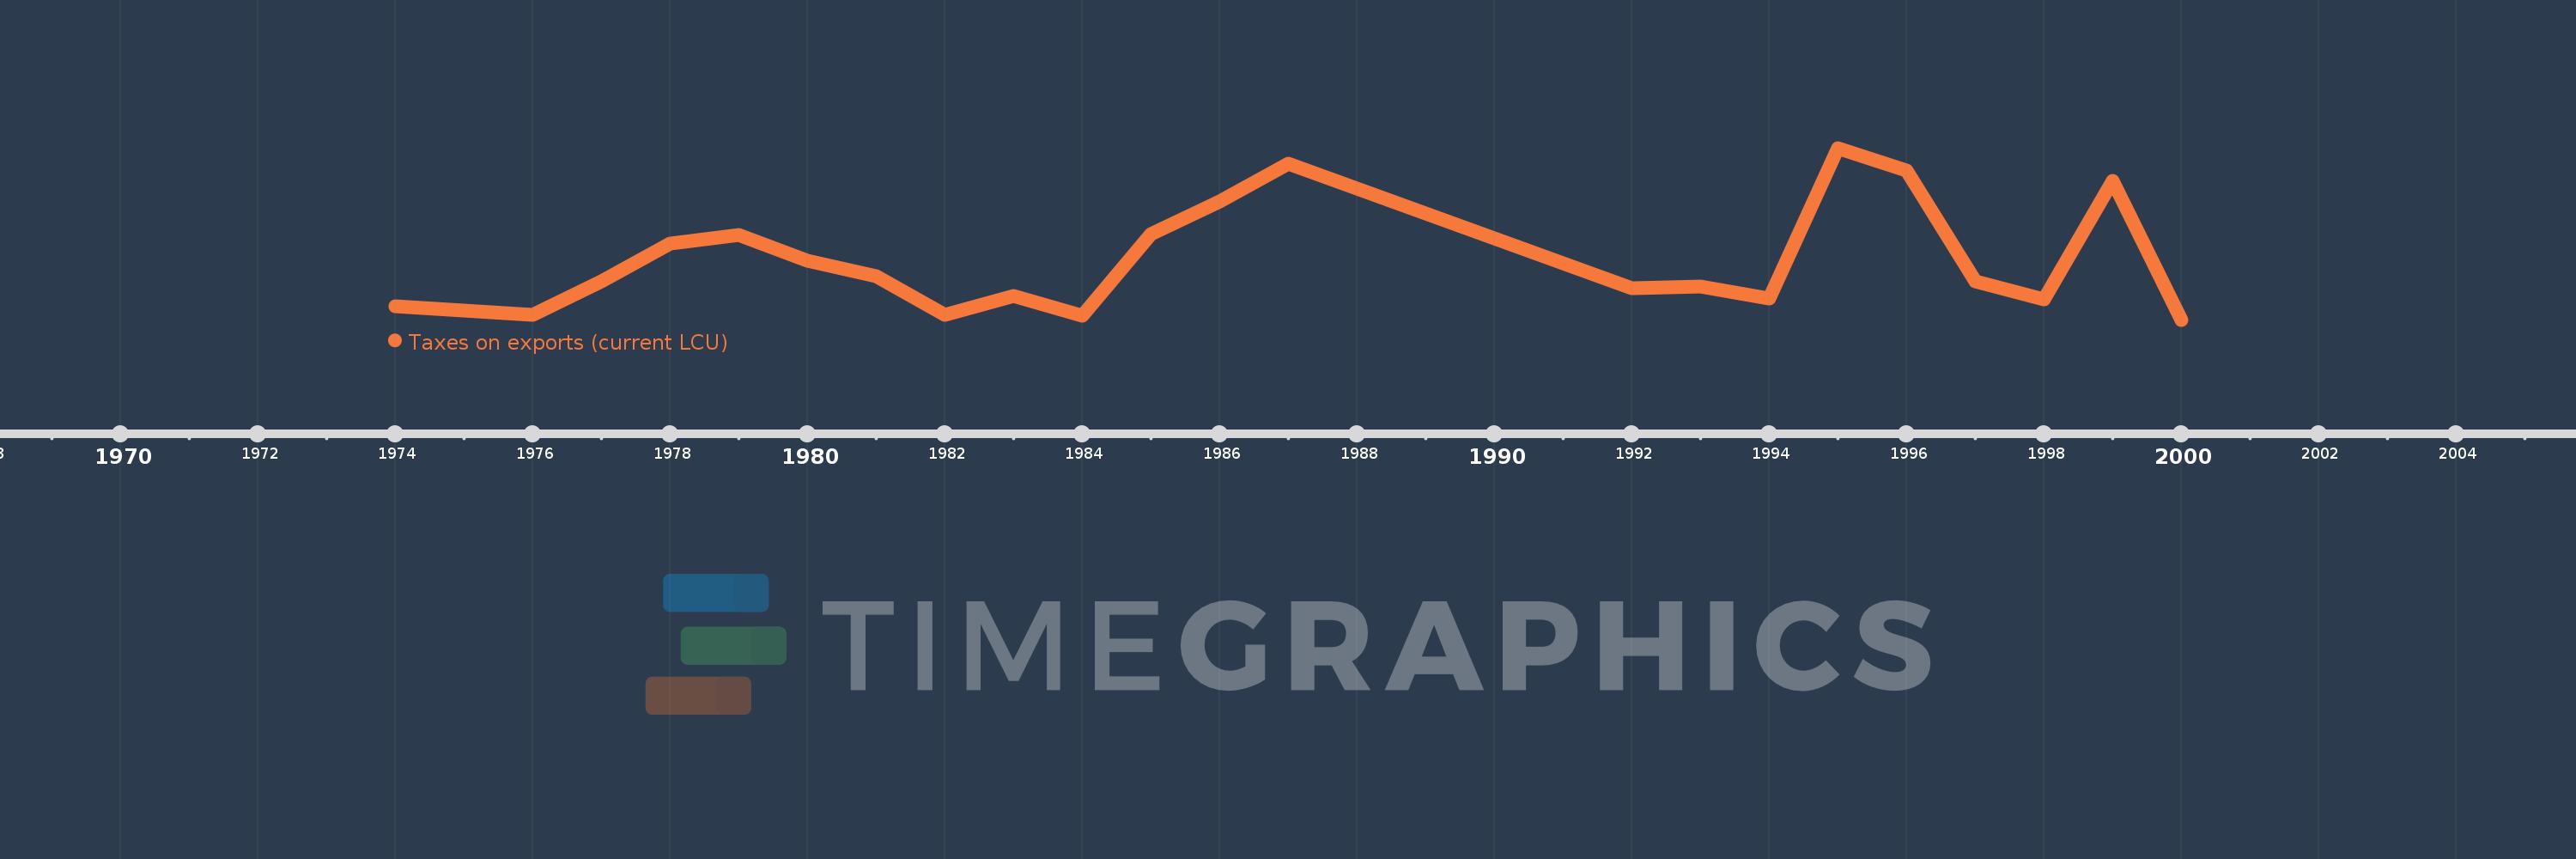
Taxes on exports (current LCU)
2000,1999,1998,1997,1996,1995,1994,1993,1992,1987,1986,1985,1984,1983,1982,1981,1980,1979,1978,1977,1976,1975,1974
This statistics in other country:
Timeline:
This timeline shows a graph from 1974 to 2000 of Burundi. No data until 1973. Number of actual observations by date: 23.
Source name:
World Development Indicators
Source organization:
International Monetary Fund, Government Finance Statistics Yearbook and data files.
Categories, topics:
Public Sector
Last updated:
apr 23, 2017
Indicators value changes by year
Minimum:
28.4 mln
jan 1, 2000
Maximum:
5.652 bln
jan 1, 1995
At the date of observation
Value
Absolute change
Change from previous value
jan 1, 1974
457.0 mln
+457.0 mln
0.0%
jan 1, 1975
331.0 mln
-126.0 mln
-27.57%
jan 1, 1976
178.0 mln
-153.0 mln
-46.22%
jan 1, 1977
1.294 bln
+1.116 bln
626.97%
jan 1, 1978
2.519 bln
+1.225 bln
94.67%
jan 1, 1979
2.803 bln
+284.0 mln
11.27%
jan 1, 1980
1.967 bln
-836.0 mln
-29.83%
jan 1, 1981
1.456 bln
-511.0 mln
-25.98%
jan 1, 1982
179.0 mln
-1.277 bln
-87.71%
jan 1, 1983
816.0 mln
+637.0 mln
355.87%
jan 1, 1984
147.0 mln
-669.0 mln
-81.99%
jan 1, 1985
2.835 bln
+2.688 bln
1.83K%
jan 1, 1986
3.909 bln
+1.074 bln
37.88%
jan 1, 1987
5.143 bln
+1.234 bln
31.57%
jan 1, 1992
1.074 bln
-4.069 bln
-79.12%
jan 1, 1993
1.106 bln
+32.0 mln
2.98%
jan 1, 1994
716.0 mln
-390.0 mln
-35.26%
jan 1, 1995
5.652 bln
+4.936 bln
689.39%
jan 1, 1996
4.919 bln
-733.0 mln
-12.97%
jan 1, 1997
1.298 bln
-3.621 bln
-73.61%
jan 1, 1998
702.0 mln
-596.0 mln
-45.92%
jan 1, 1999
4.562 bln
+3.86 bln
549.84%
jan 1, 2000
28.4 mln
-4.534 bln
-99.38%
Ranking of countries by current statistics by years


Comments: