30
/
AIzaSyAYiBZKx7MnpbEhh9jyipgxe19OcubqV5w
April 1, 2024
166911
Kazakhstan
KAZ
true
2
1
Taxes on exports (current LCU)
2016,2015,2014,2013,2012,2011,2005,2004,2003,2002,2001,1998
Public Timelines
FAQ
Menu
Public Timelines
FAQ
Public Timelines
FAQ
For education
For educational institutions
For teachers
For students
Open cabinet
For educational institutions
For teachers
For students
Open cabinet
Create
Close
Create a timeline
Public timelines
Library
FAQ
Download
Global statistics library
→
Kazakhstan
→
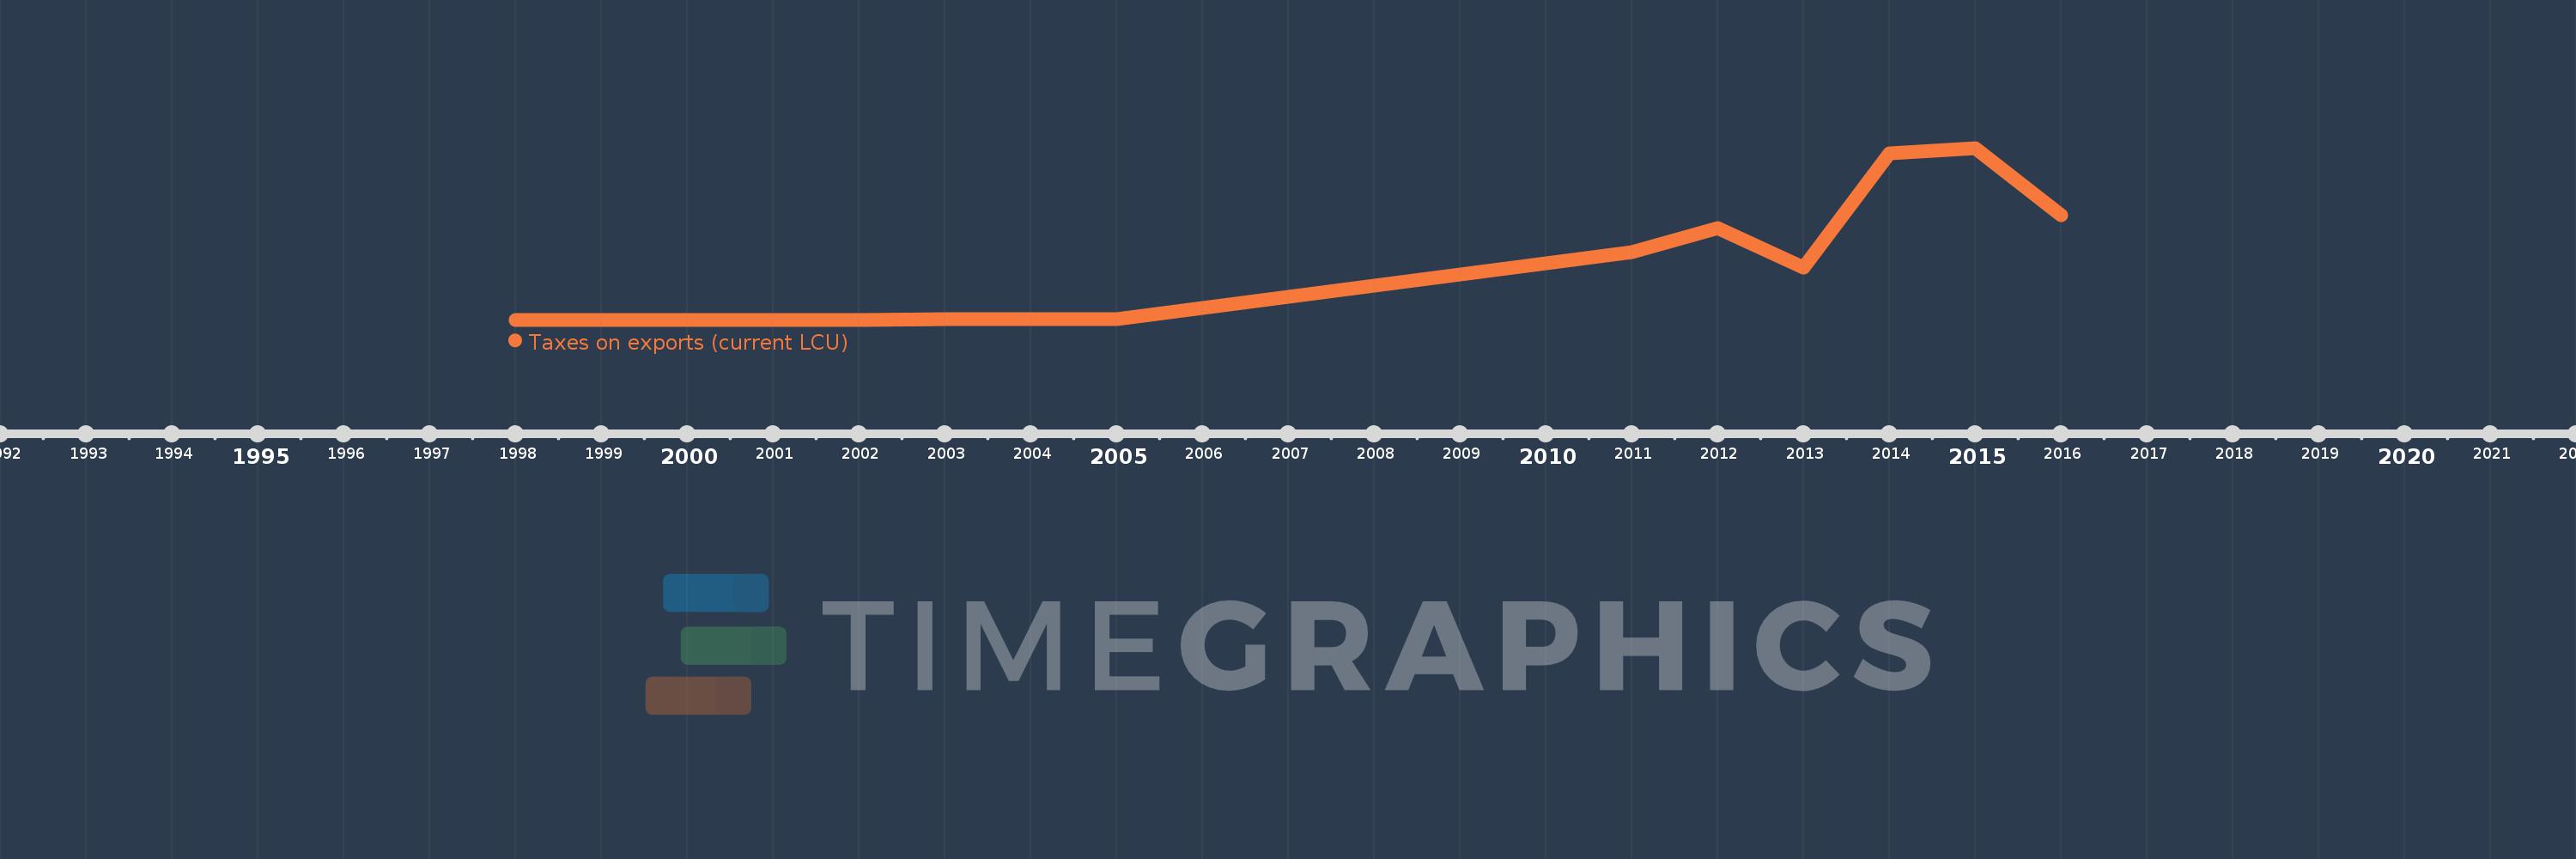
Taxes on exports (current LCU)
This statistics in other country:
Afghanistan
Albania
Algeria
Angola
Argentina
Australia
Austria
Azerbaijan
Bahamas, The
Bangladesh
Barbados
Belarus
Belize
Benin
Bhutan
Bolivia
Bosnia and Herzegovina
Botswana
Brazil
Bulgaria
Burundi
Cambodia
Central African Republic
Congo, Dem. Rep.
Congo, Rep.
Costa Rica
Cote d'Ivoire
Cyprus
Dominican Republic
Egypt, Arab Rep.
El Salvador
Equatorial Guinea
Ethiopia
Fiji
Finland
Gambia, The
Ghana
Greece
Grenada
Guatemala
Honduras
Hungary
Iceland
India
Indonesia
Iran, Islamic Rep.
Iraq
Jamaica
Kazakhstan
Kenya
Kyrgyz Republic
Lao PDR
Latvia
Lesotho
Liberia
Lithuania
Macedonia, FYR
Madagascar
Malaysia
Maldives
Mali
Malta
Mauritius
Mexico
Mongolia
Morocco
Namibia
Nepal
New Zealand
Nicaragua
Norway
Pakistan
Panama
Papua New Guinea
Peru
Poland
Portugal
Russian Federation
Rwanda
Sao Tome and Principe
Sierra Leone
Solomon Islands
South Africa
Sri Lanka
St. Kitts and Nevis
Suriname
Swaziland
Syrian Arab Republic
Tajikistan
Tanzania
Thailand
Togo
Tunisia
Uganda
Ukraine
United Kingdom
Uruguay
Vanuatu
Zambia
Timeline:
This timeline shows a graph from
1998
to
2016
of Kazakhstan. No data until
1997
. Number of actual observations by date:
12
.
Source name:
World Development Indicators
Source organization:
International Monetary Fund, Government Finance Statistics Yearbook and data files.
Categories, topics:
Public Sector
Last updated:
apr 23, 2017
Indicators value changes by year
Meaning:
481.826 bln
Minimum:
2.0 mln
jan 1, 1998
Maximum:
1.514 trl
jan 1, 2015
At the date of observation
Value
Absolute change
Change from the previous value
jan 1, 1998
2.0 mln
+2.0 mln
0.0%
jan 1, 2001
120.718 mln
+118.718 mln
5.94K%
jan 1, 2002
1.073 bln
+952.658 mln
789.16%
jan 1, 2003
3.885 bln
+2.812 bln
261.94%
jan 1, 2004
4.433 bln
+548.134 mln
14.11%
jan 1, 2005
5.967 bln
+1.534 bln
34.6%
jan 1, 2011
598.319 bln
+592.352 bln
9.93K%
jan 1, 2012
809.12 bln
+210.801 bln
35.23%
jan 1, 2013
457.657 bln
-351.463 bln
-43.44%
jan 1, 2014
1.467 trl
+1.009 trl
220.5%
jan 1, 2015
1.514 trl
+47.181 bln
3.22%
jan 1, 2016
920.582 bln
-593.386 bln
-39.19%
Ranking of countries by current statistics by years
About & Feedback
Terms
Privacy
Library
2024
©
Time.Graphics
Support 24/7
Cabinet
Get premium
Donate
The service accepts bank transfer (ACH, Wire) or cards (Visa, MasterCard, etc). Processed by Stripe.
Secured with SSL
Excellent (Trustpilot Reviews)
Based on 115+ reviews
Write your own review on
Trustpilot.com
