29
/
en
AIzaSyAYiBZKx7MnpbEhh9jyipgxe19OcubqV5w
April 1, 2024
110407
Congo, Dem. Rep.
COD
true
2
1
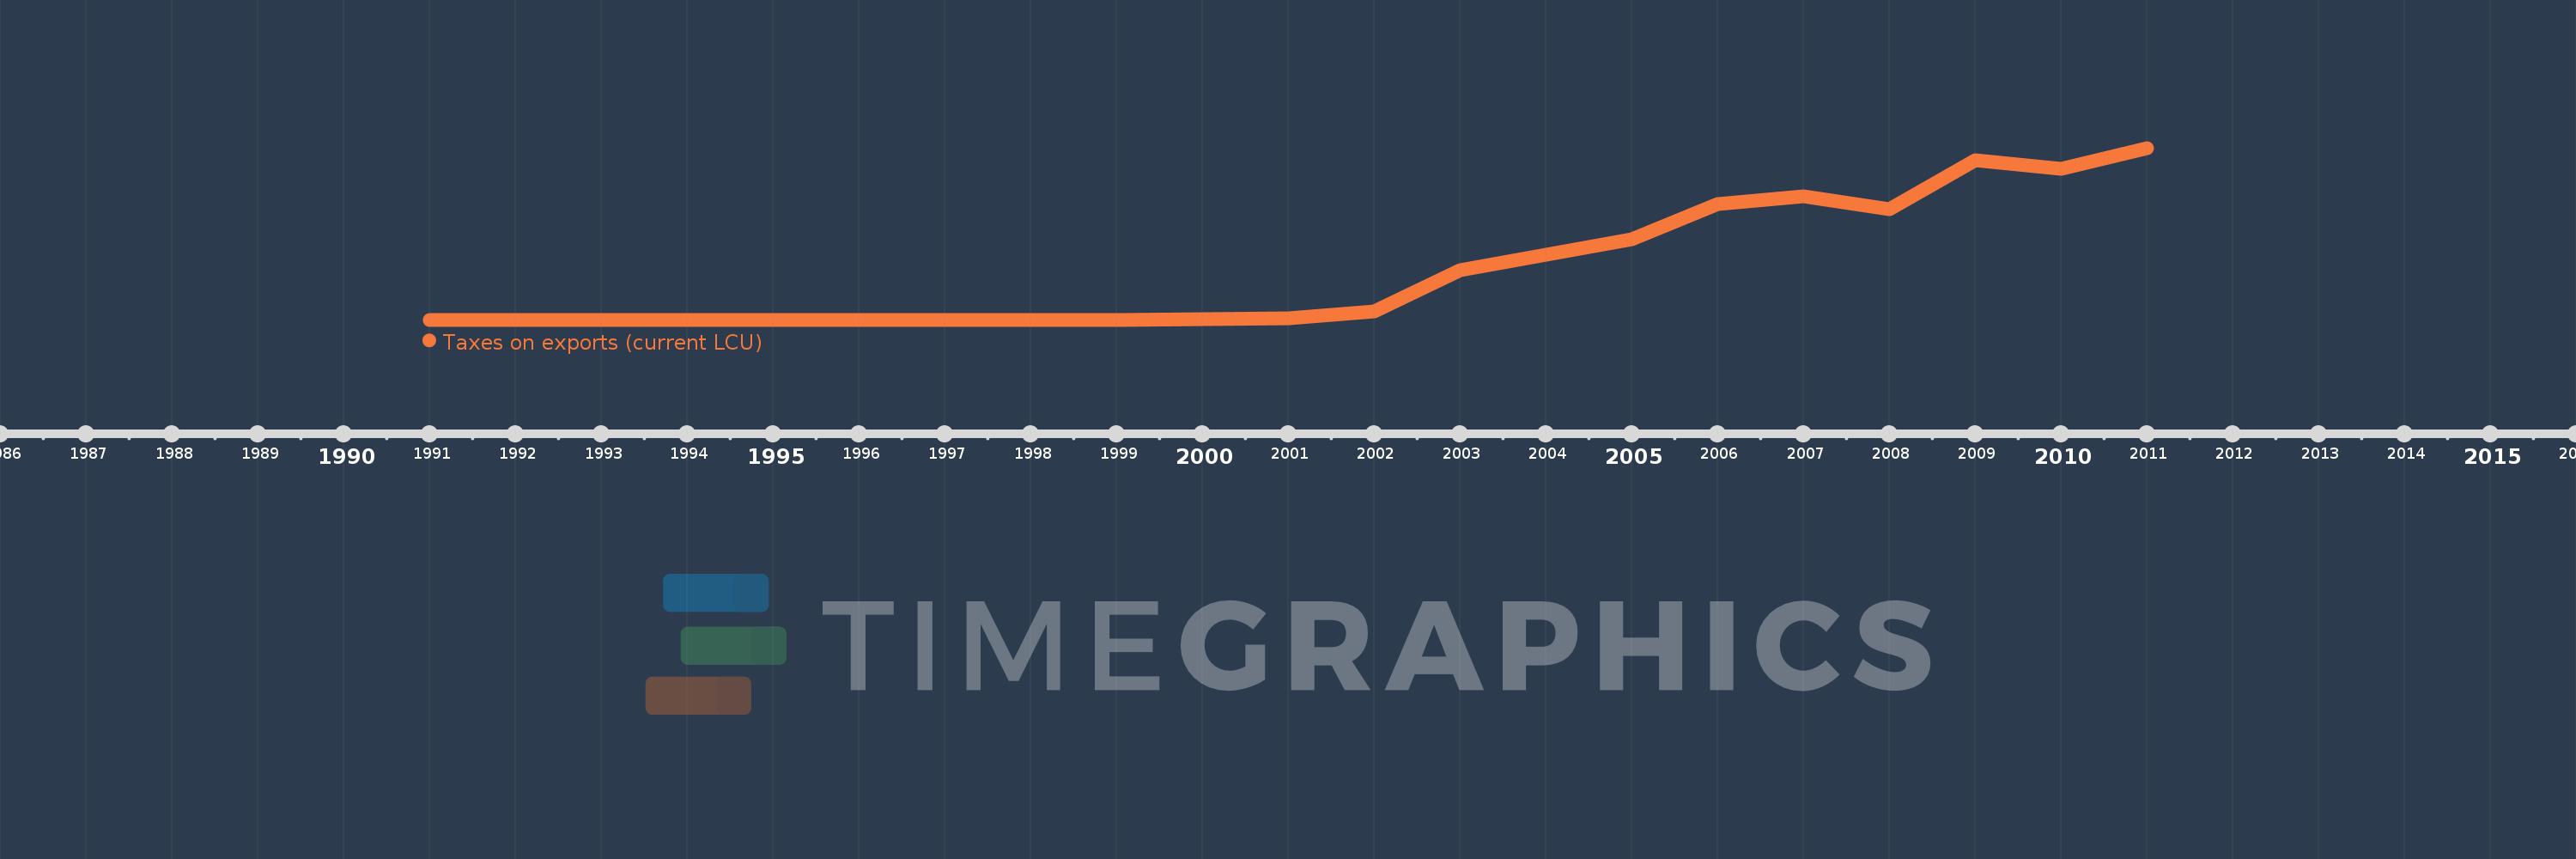
Taxes on exports (current LCU)
2011,2010,2009,2008,2007,2006,2005,2004,2003,2002,2001,2000,1999,1998,1997,1996,1995,1994,1993,1992,1991
This statistics in other country:
Timeline:
This timeline shows a graph from 1991 to 2011 of Congo, Dem. Rep.. No data until 1990. Number of actual observations by date: 21.
Source name:
World Development Indicators
Source organization:
International Monetary Fund, Government Finance Statistics Yearbook and data files.
Categories, topics:
Public Sector
Last updated:
apr 23, 2017
Indicators value changes by year
Maximum:
13.438 bln
jan 1, 2011
At the date of observation
Value
Absolute change
Change from previous value
jan 1, 1991
0.086
+0.086
0.0%
jan 1, 1992
0.977
+0.891
1.04K%
jan 1, 1993
34.5
+33.523
3.43K%
jan 1, 1994
1.144K
+1.109K
3.21K%
jan 1, 1995
196.32K
+195.176K
17.07K%
jan 1, 1996
500.0K
+303.68K
154.69%
jan 1, 1997
4.53 mln
+4.03 mln
806.0%
jan 1, 1998
6.24 mln
+1.71 mln
37.75%
jan 1, 1999
9.111 mln
+2.871 mln
46.01%
jan 1, 2000
23.0 mln
+13.889 mln
152.44%
jan 1, 2001
114.876 mln
+91.876 mln
399.46%
jan 1, 2002
653.551 mln
+538.675 mln
468.92%
jan 1, 2003
3.848 bln
+3.195 bln
488.8%
jan 1, 2004
5.12 bln
+1.271 bln
33.04%
jan 1, 2005
6.325 bln
+1.206 bln
23.55%
jan 1, 2006
9.039 bln
+2.714 bln
42.9%
jan 1, 2007
9.63 bln
+591.501 mln
6.54%
jan 1, 2008
8.679 bln
-951.39 mln
-9.88%
jan 1, 2009
12.496 bln
+3.817 bln
43.98%
jan 1, 2010
11.832 bln
-663.856 mln
-5.31%
jan 1, 2011
13.438 bln
+1.605 bln
13.57%
Ranking of countries by current statistics by years


Comments: