29
/
en
AIzaSyAYiBZKx7MnpbEhh9jyipgxe19OcubqV5w
April 1, 2024
234219
Sao Tome and Principe
STP
true
2
1
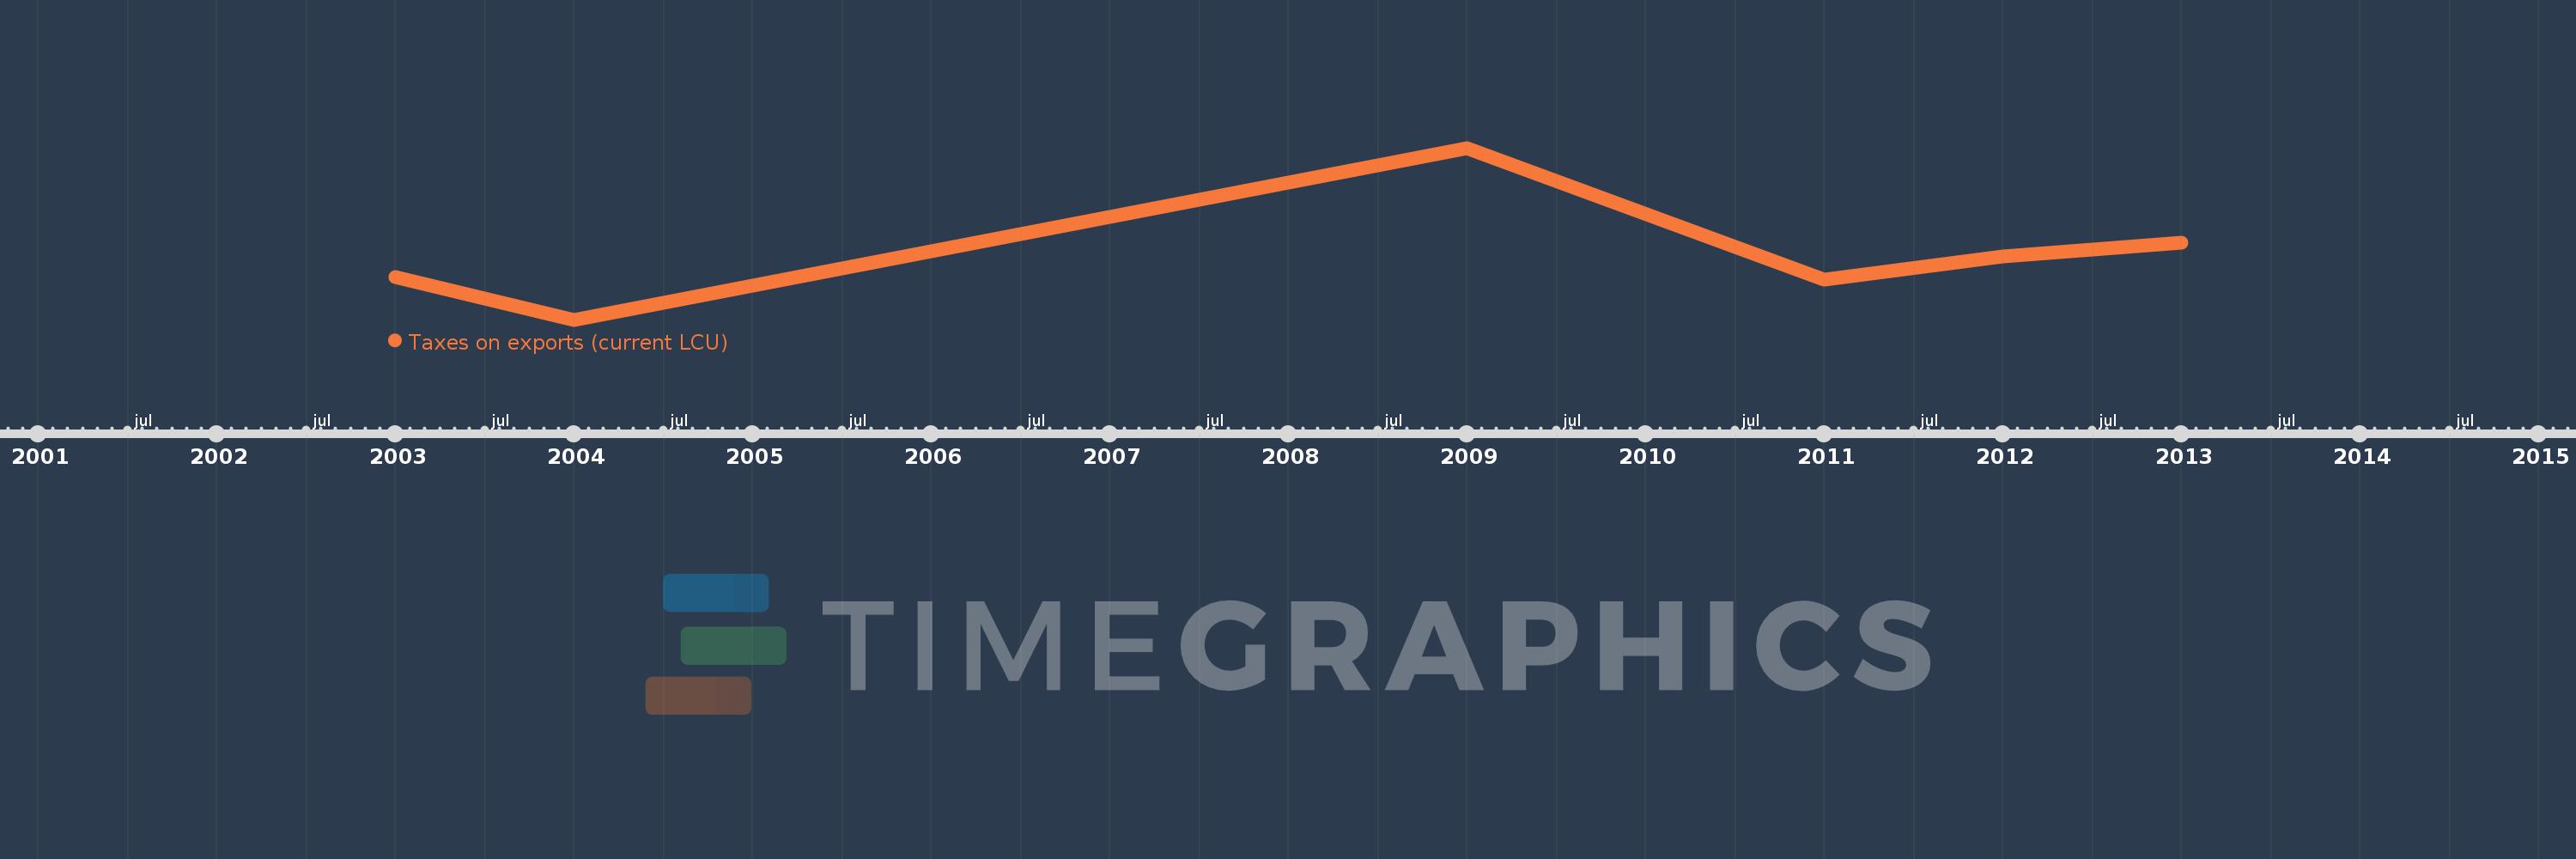
Taxes on exports (current LCU)
2013,2012,2011,2009,2004,2003
This statistics in other country:
Timeline:
This timeline shows a graph from 2003 to 2013 of Sao Tome and Principe. No data until 2002. Number of actual observations by date: 6.
Source name:
World Development Indicators
Source organization:
International Monetary Fund, Government Finance Statistics Yearbook and data files.
Categories, topics:
Public Sector
Last updated:
apr 23, 2017
Indicators value changes by year
Minimum:
1000.0K
jan 1, 2004
Maximum:
20.992 mln
jan 1, 2009
At the date of observation
Value
Absolute change
Change from previous value
jan 1, 2003
6.0 mln
+6.0 mln
0.0%
jan 1, 2004
1000.0K
-5.0 mln
-83.33%
jan 1, 2009
20.992 mln
+19.992 mln
2.0K%
jan 1, 2011
5.693 mln
-15.298 mln
-72.88%
jan 1, 2012
8.363 mln
+2.669 mln
46.89%
jan 1, 2013
10.0 mln
+1.637 mln
19.58%
Ranking of countries by current statistics by years


Comments: