29
/
en
AIzaSyAYiBZKx7MnpbEhh9jyipgxe19OcubqV5w
April 1, 2024
220279
Papua New Guinea
PNG
true
2
1
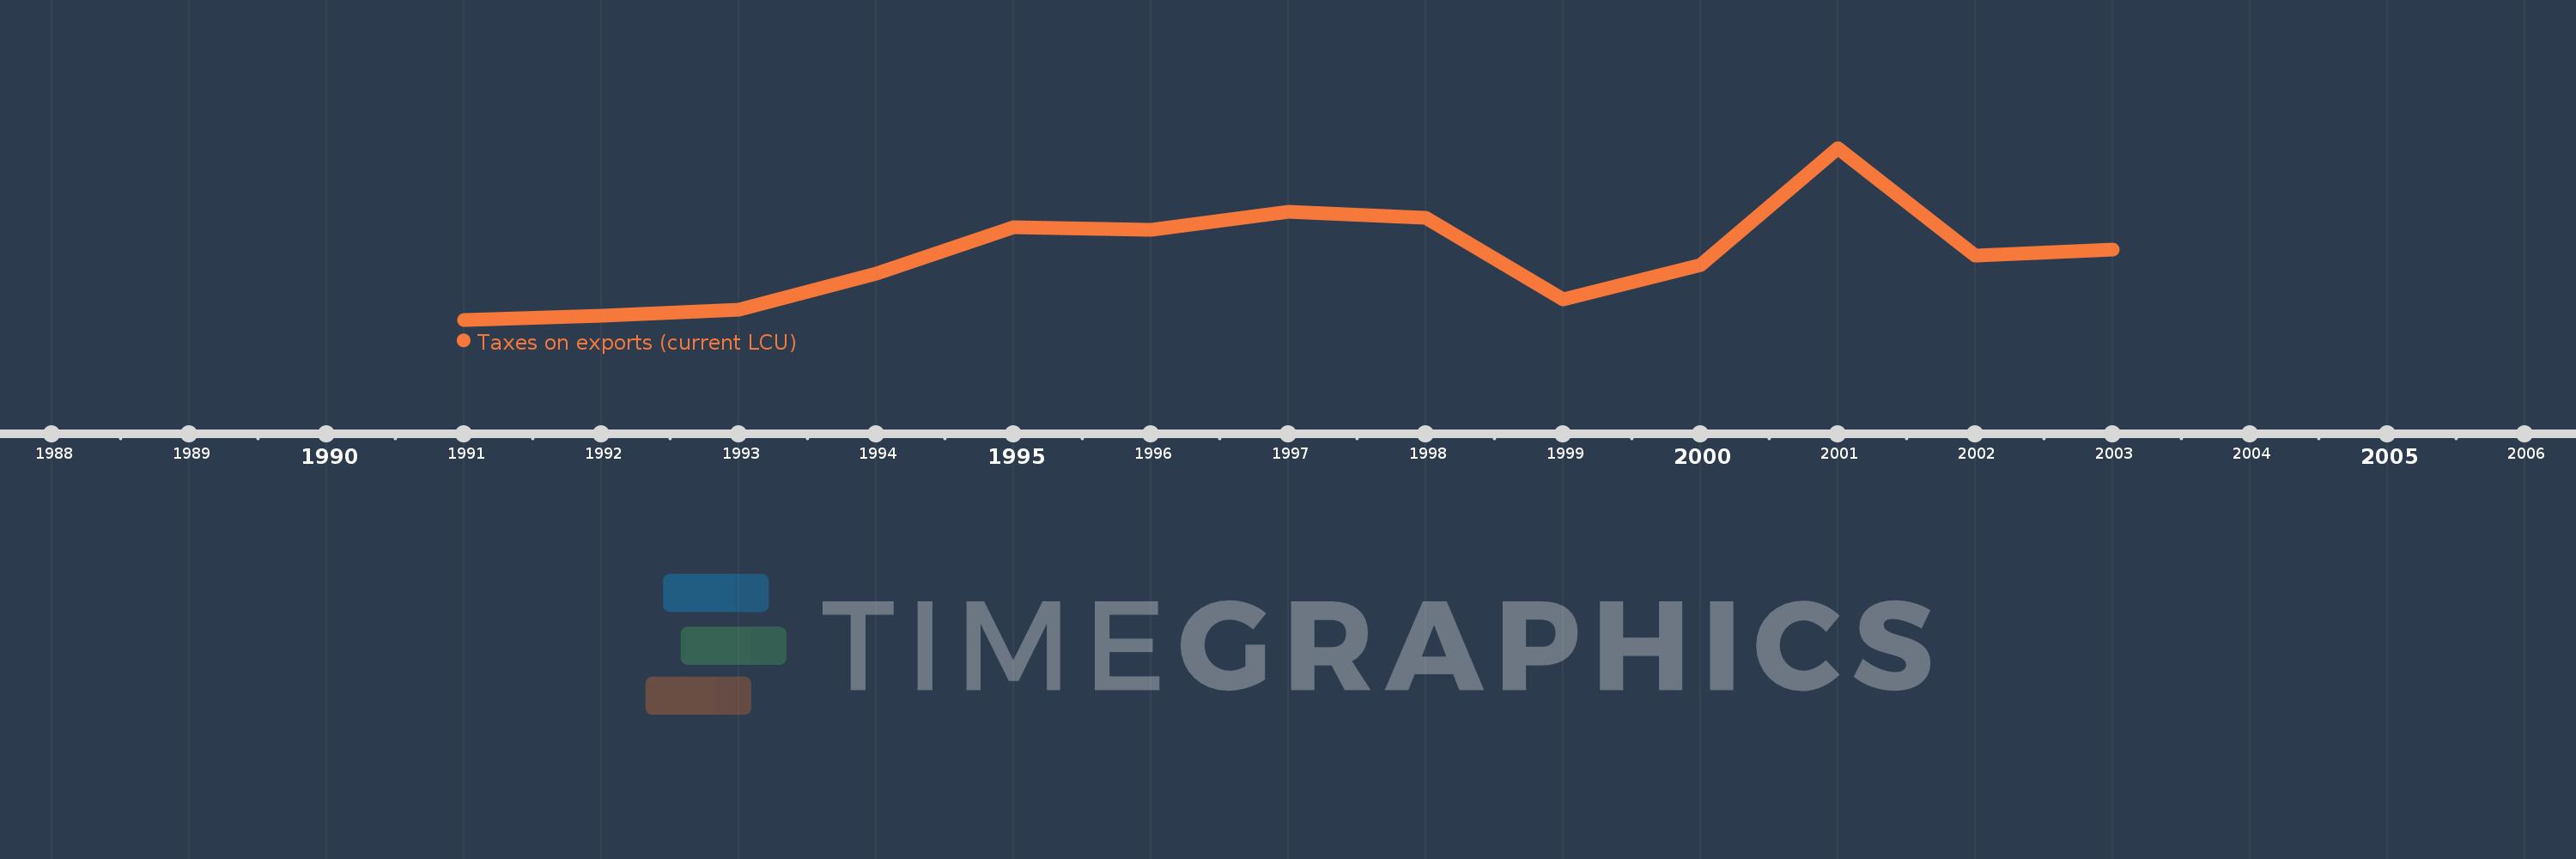
Taxes on exports (current LCU)
2003,2002,2001,2000,1999,1998,1997,1996,1995,1994,1993,1992,1991
This statistics in other country:
Timeline:
This timeline shows a graph from 1991 to 2003 of Papua New Guinea. No data until 1990. Number of actual observations by date: 13.
Source name:
World Development Indicators
Source organization:
International Monetary Fund, Government Finance Statistics Yearbook and data files.
Categories, topics:
Public Sector
Last updated:
apr 23, 2017
Indicators value changes by year
Minimum:
12.68 mln
jan 1, 1991
Maximum:
242.348 mln
jan 1, 2001
At the date of observation
Value
Absolute change
Change from previous value
jan 1, 1991
12.68 mln
+12.68 mln
0.0%
jan 1, 1992
18.41 mln
+5.73 mln
45.19%
jan 1, 1993
26.13 mln
+7.72 mln
41.93%
jan 1, 1994
73.93 mln
+47.8 mln
182.93%
jan 1, 1995
136.814 mln
+62.884 mln
85.06%
jan 1, 1996
132.851 mln
-3.963 mln
-2.9%
jan 1, 1997
157.187 mln
+24.336 mln
18.32%
jan 1, 1998
149.443 mln
-7.744 mln
-4.93%
jan 1, 1999
40.1 mln
-109.343 mln
-73.17%
jan 1, 2000
85.985 mln
+45.885 mln
114.43%
jan 1, 2001
242.348 mln
+156.363 mln
181.85%
jan 1, 2002
98.342 mln
-144.006 mln
-59.42%
jan 1, 2003
106.756 mln
+8.414 mln
8.56%
Ranking of countries by current statistics by years


Comments: