This statistics in other country:
Timeline:
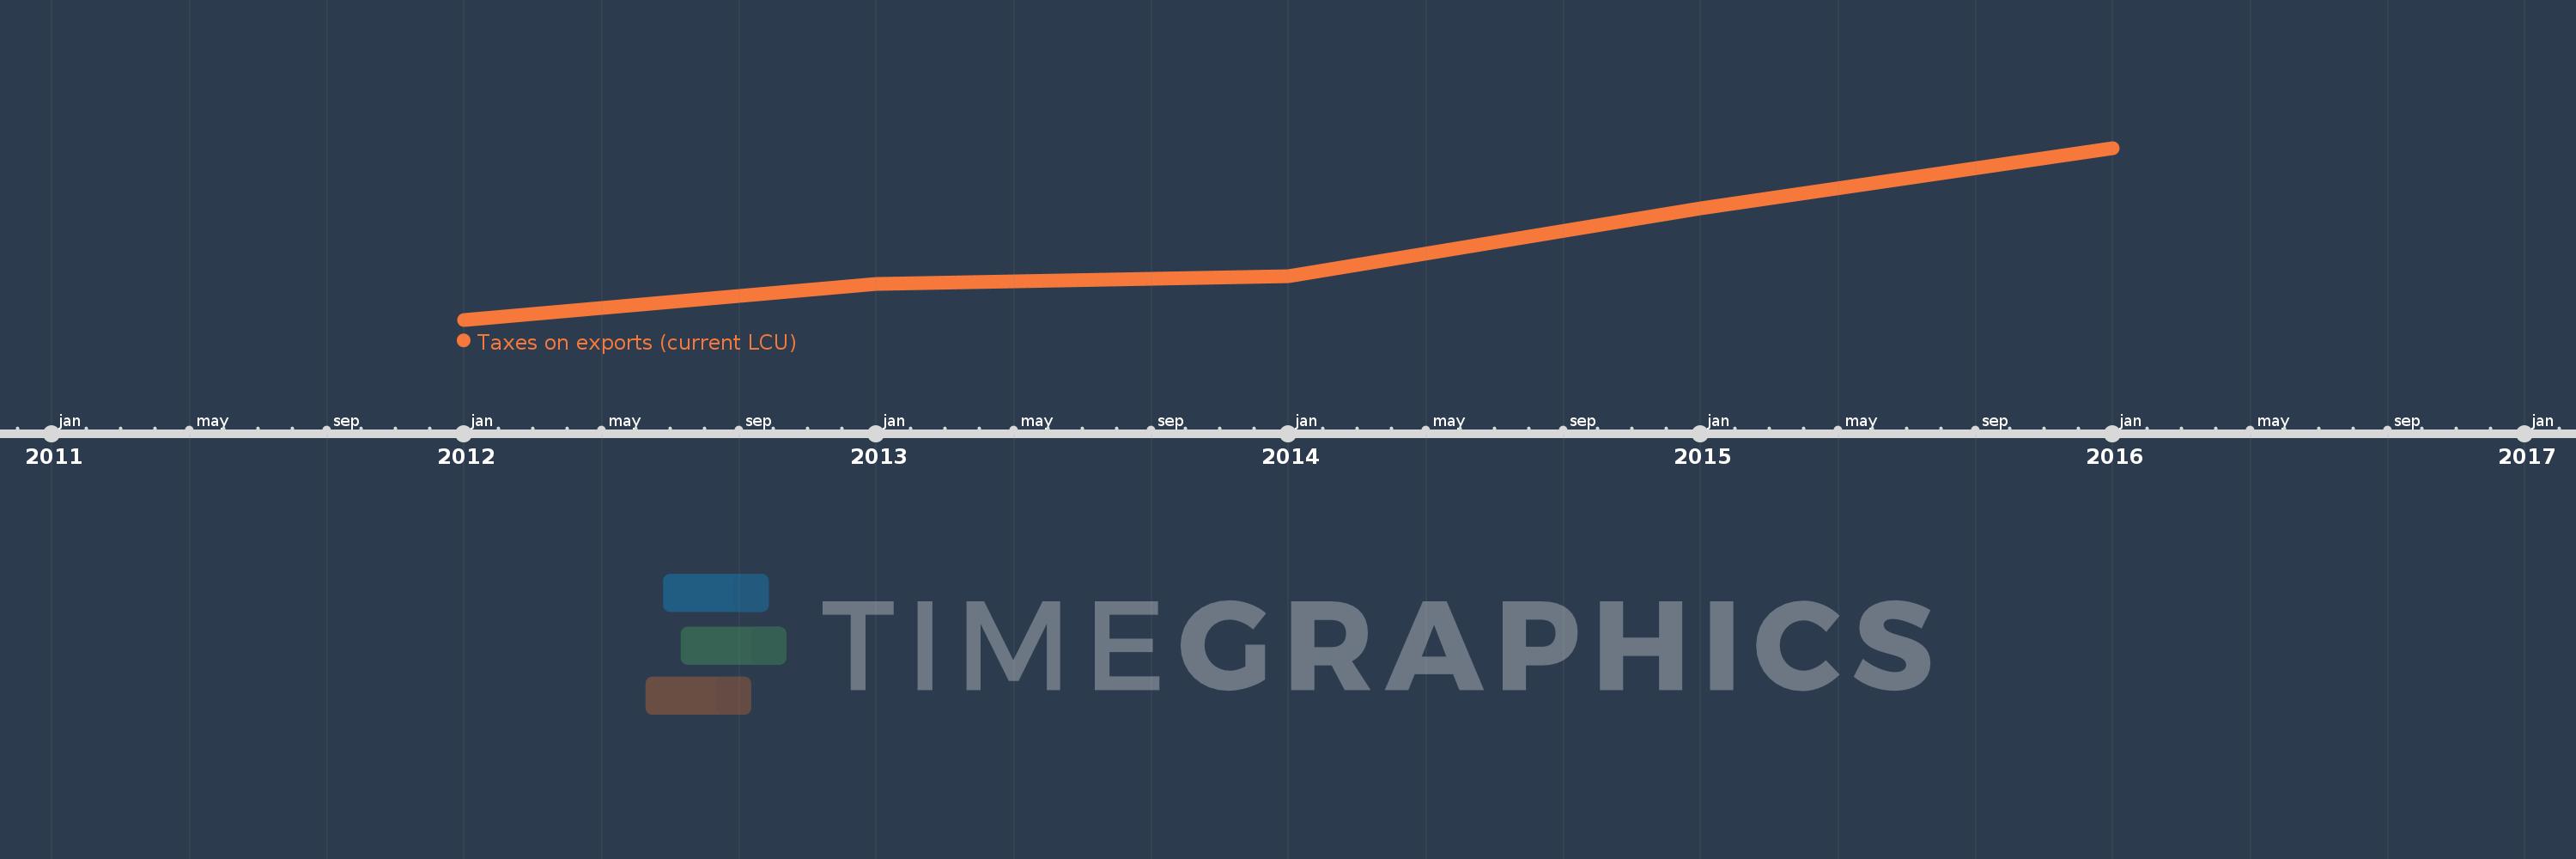
This timeline shows a graph from 2012 to 2016 of Solomon Islands. No data until 2011. Number of actual observations by date: 5.
Source name:
World Development Indicators
Source organization:
International Monetary Fund, Government Finance Statistics Yearbook and data files.
Categories, topics:
Public Sector
Last updated:
apr 23, 2017
Indicators value changes by year
Minimum:
379.384 mln
jan 1, 2012
Maximum:
560.672 mln
jan 1, 2016
At the date of observation
Value
Absolute change
Change from previous value
jan 1, 2012
379.384 mln
+379.384 mln
0.0%
jan 1, 2013
417.621 mln
+38.236 mln
10.08%
jan 1, 2014
425.336 mln
+7.715 mln
1.85%
jan 1, 2015
497.111 mln
+71.775 mln
16.87%
jan 1, 2016
560.672 mln
+63.561 mln
12.79%
Ranking of countries by current statistics by years


Comments: