29
/
en
AIzaSyAYiBZKx7MnpbEhh9jyipgxe19OcubqV5w
April 1, 2024
145150
Guatemala
GTM
true
2
1
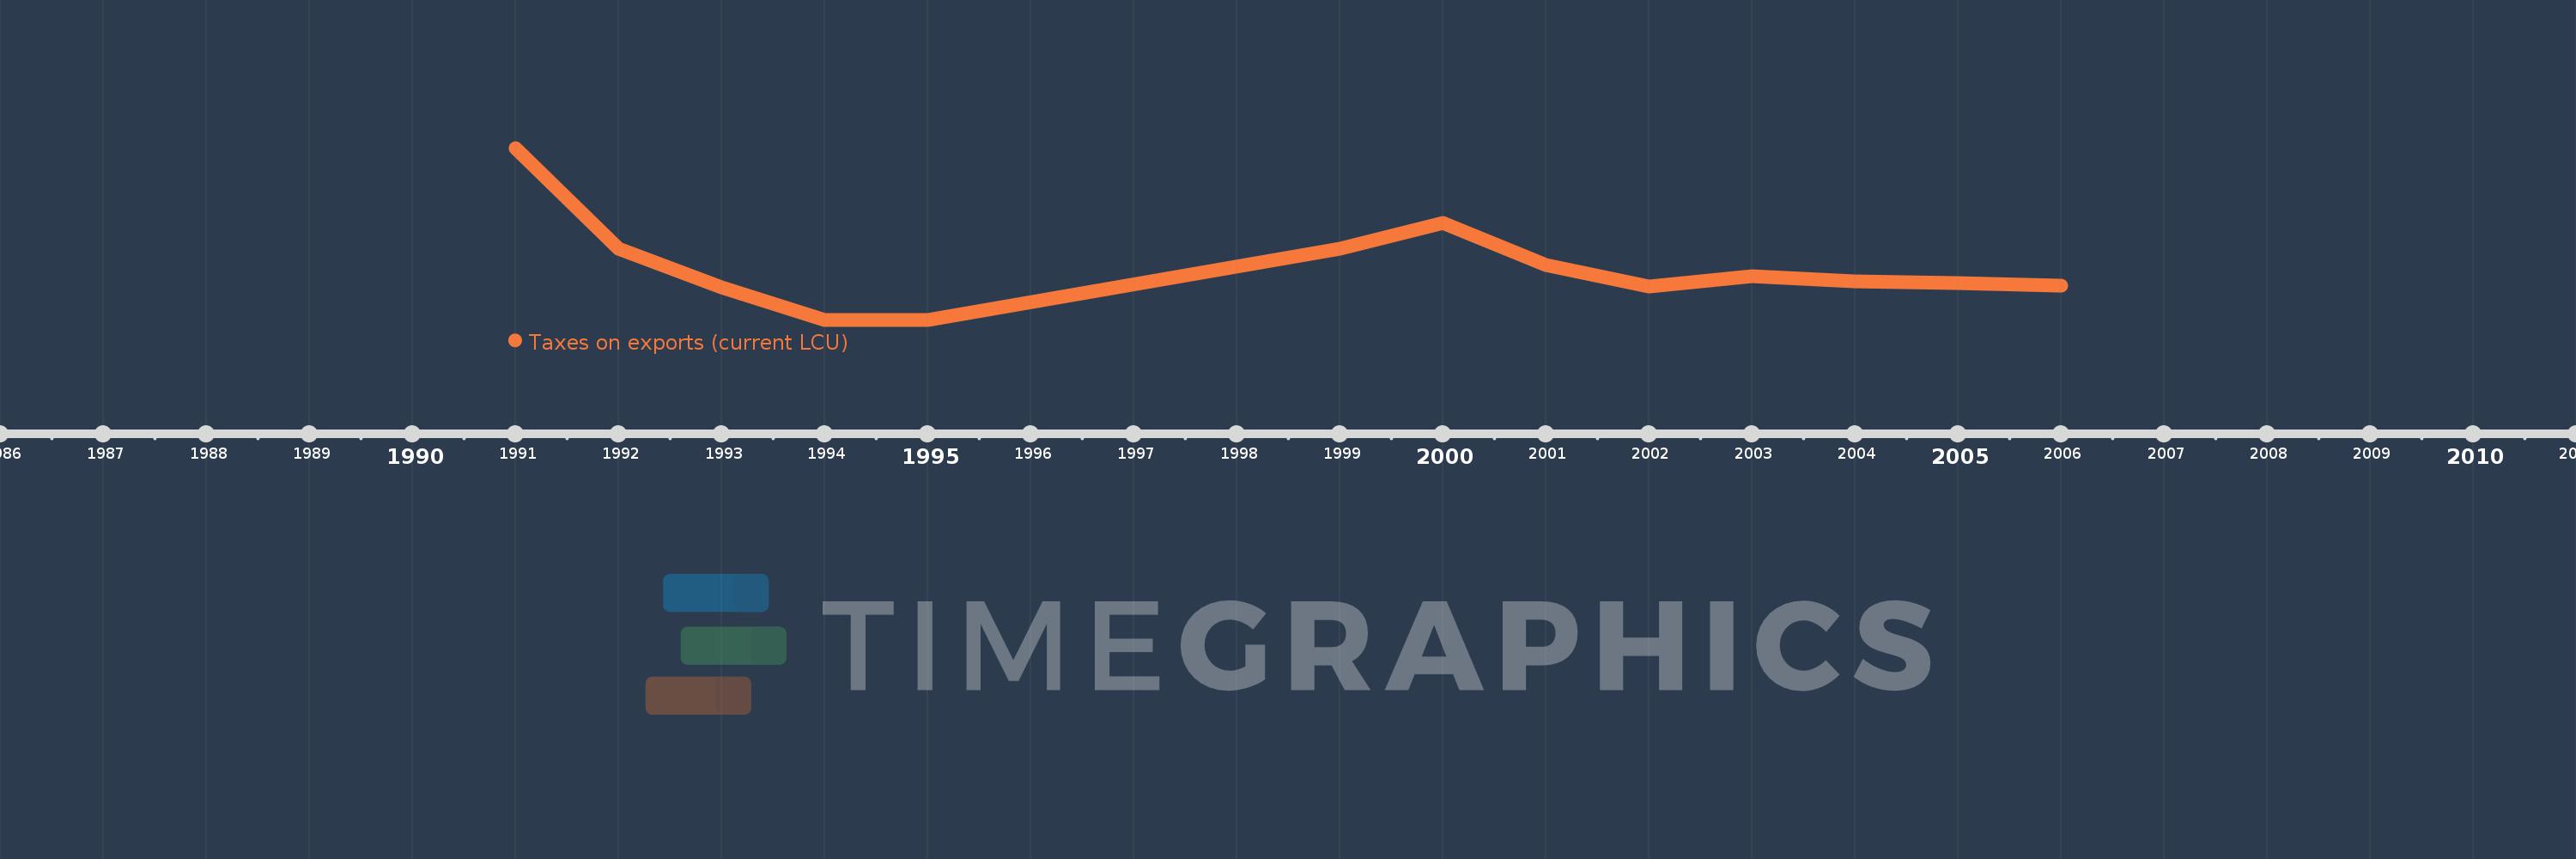
Taxes on exports (current LCU)
2006,2005,2004,2003,2002,2001,2000,1999,1995,1994,1993,1992,1991
This statistics in other country:
Timeline:
This timeline shows a graph from 1991 to 2006 of Guatemala. No data until 1990. Number of actual observations by date: 13.
Source name:
World Development Indicators
Source organization:
International Monetary Fund, Government Finance Statistics Yearbook and data files.
Categories, topics:
Public Sector
Last updated:
apr 23, 2017
Indicators value changes by year
Maximum:
4.63 mln
jan 1, 1991
At the date of observation
Value
Absolute change
Change from previous value
jan 1, 1991
4.63 mln
+4.63 mln
0.0%
jan 1, 1992
1.92 mln
-2.71 mln
-58.53%
jan 1, 1993
880.0K
-1.04 mln
-54.17%
jan 1, 1994
10.0K
-870.0K
-98.86%
jan 1, 1995
10.0K
0.0
0.0%
jan 1, 1999
1.91 mln
+1.9 mln
19.0K%
jan 1, 2000
2.61 mln
+700.0K
36.65%
jan 1, 2001
1.49 mln
-1.12 mln
-42.91%
jan 1, 2002
900.0K
-590.0K
-39.6%
jan 1, 2003
1.19 mln
+290.0K
32.22%
jan 1, 2004
1.04 mln
-150.0K
-12.61%
jan 1, 2005
1000.0K
-40.0K
-3.85%
jan 1, 2006
930.0K
-70.0K
-7.0%
Ranking of countries by current statistics by years


Comments: