29
/
en
AIzaSyAYiBZKx7MnpbEhh9jyipgxe19OcubqV5w
April 1, 2024
91922
Brazil
BRA
true
2
1
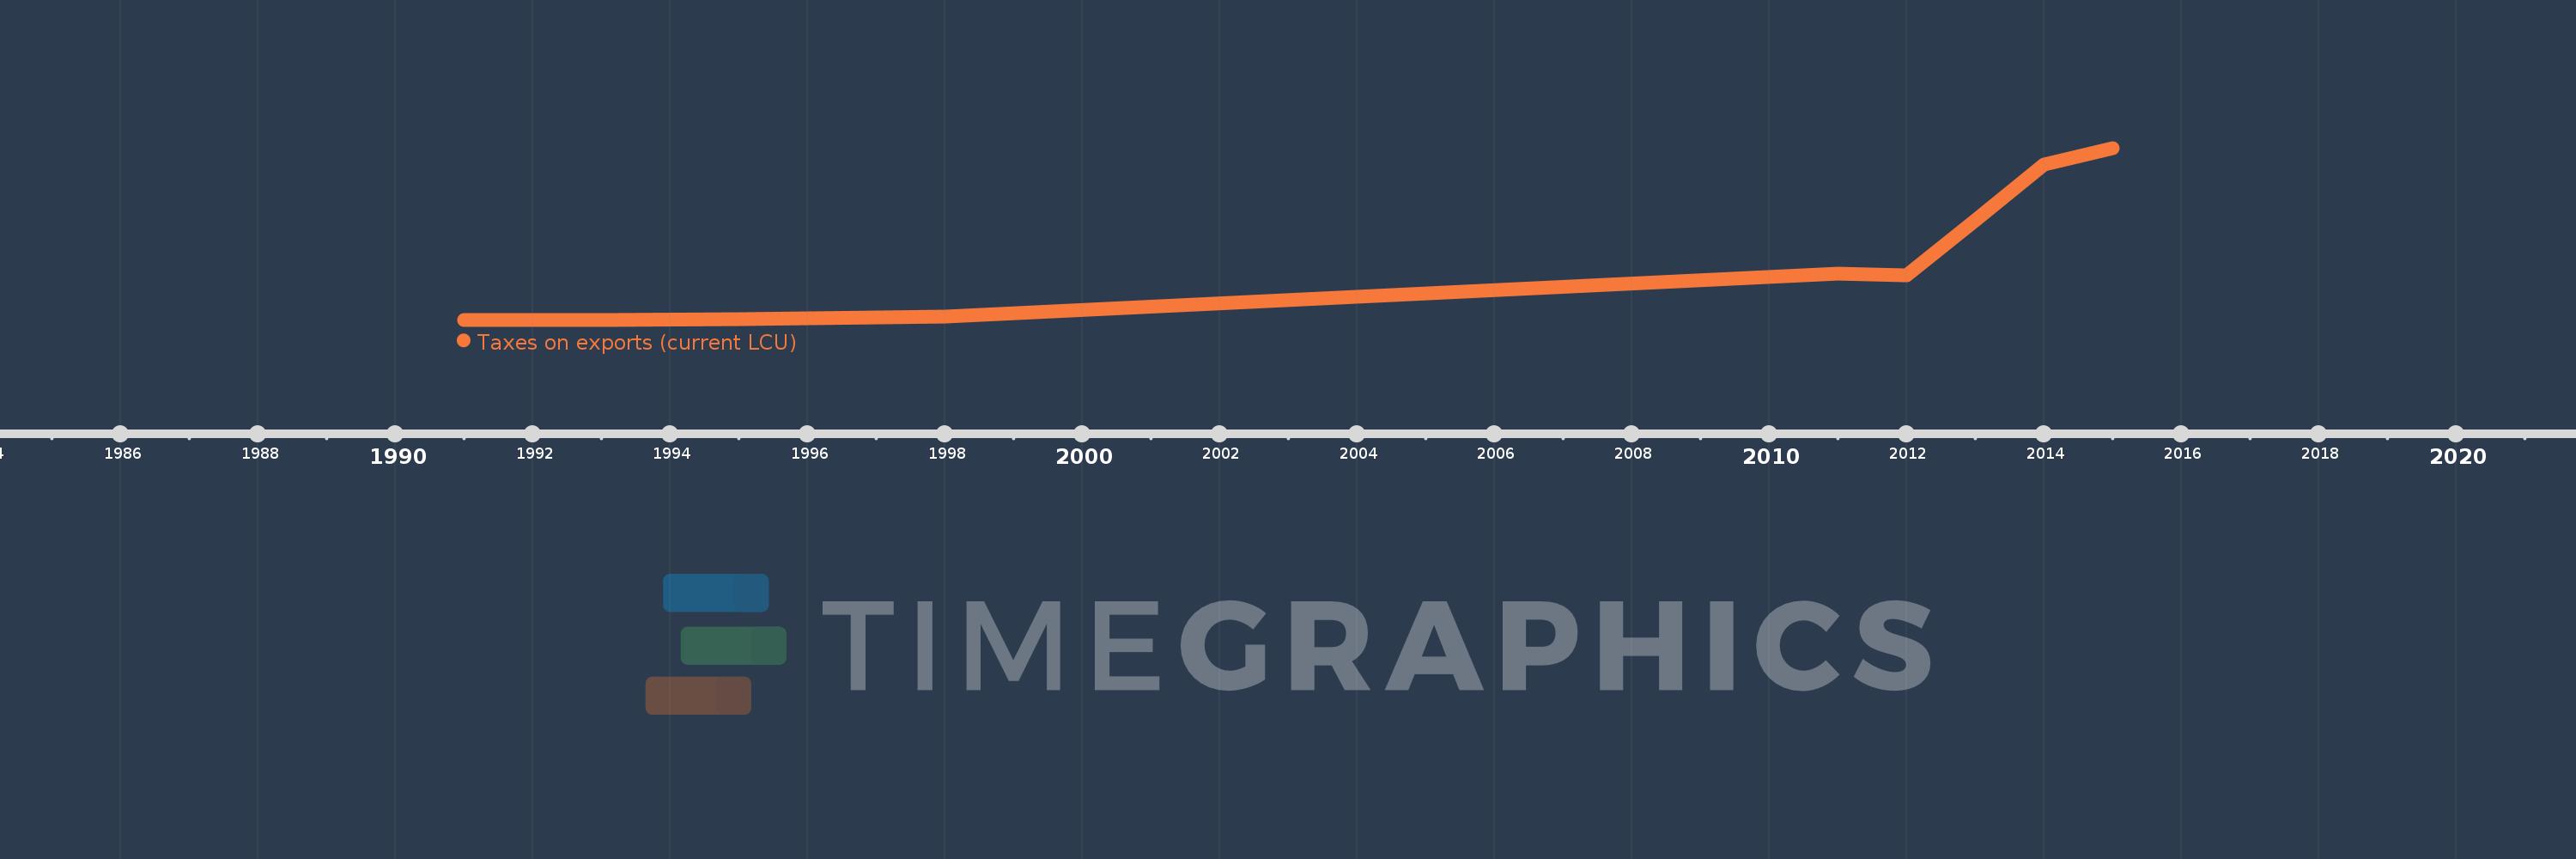
Taxes on exports (current LCU)
2015,2014,2013,2012,2011,1998,1995,1993,1992,1991
This statistics in other country:
Timeline:
This timeline shows a graph from 1991 to 2015 of Brazil. No data until 1990. Number of actual observations by date: 10.
Source name:
World Development Indicators
Source organization:
International Monetary Fund, Government Finance Statistics Yearbook and data files.
Categories, topics:
Public Sector
Last updated:
apr 23, 2017
Indicators value changes by year
Minimum:
1.018K
jan 1, 1991
Maximum:
162.124 mln
jan 1, 2015
At the date of observation
Value
Absolute change
Change from previous value
jan 1, 1991
1.018K
+1.018K
0.0%
jan 1, 1992
1.527K
+509.091
50.0%
jan 1, 1993
1.2K
-327.273
-21.43%
jan 1, 1995
400.0K
+398.8K
33.23K%
jan 1, 1998
2.9 mln
+2.5 mln
625.0%
jan 1, 2011
43.872 mln
+40.972 mln
1.41K%
jan 1, 2012
41.778 mln
-2.094 mln
-4.77%
jan 1, 2013
93.582 mln
+51.804 mln
124.0%
jan 1, 2014
146.099 mln
+52.517 mln
56.12%
jan 1, 2015
162.124 mln
+16.025 mln
10.97%
Ranking of countries by current statistics by years


Comments: