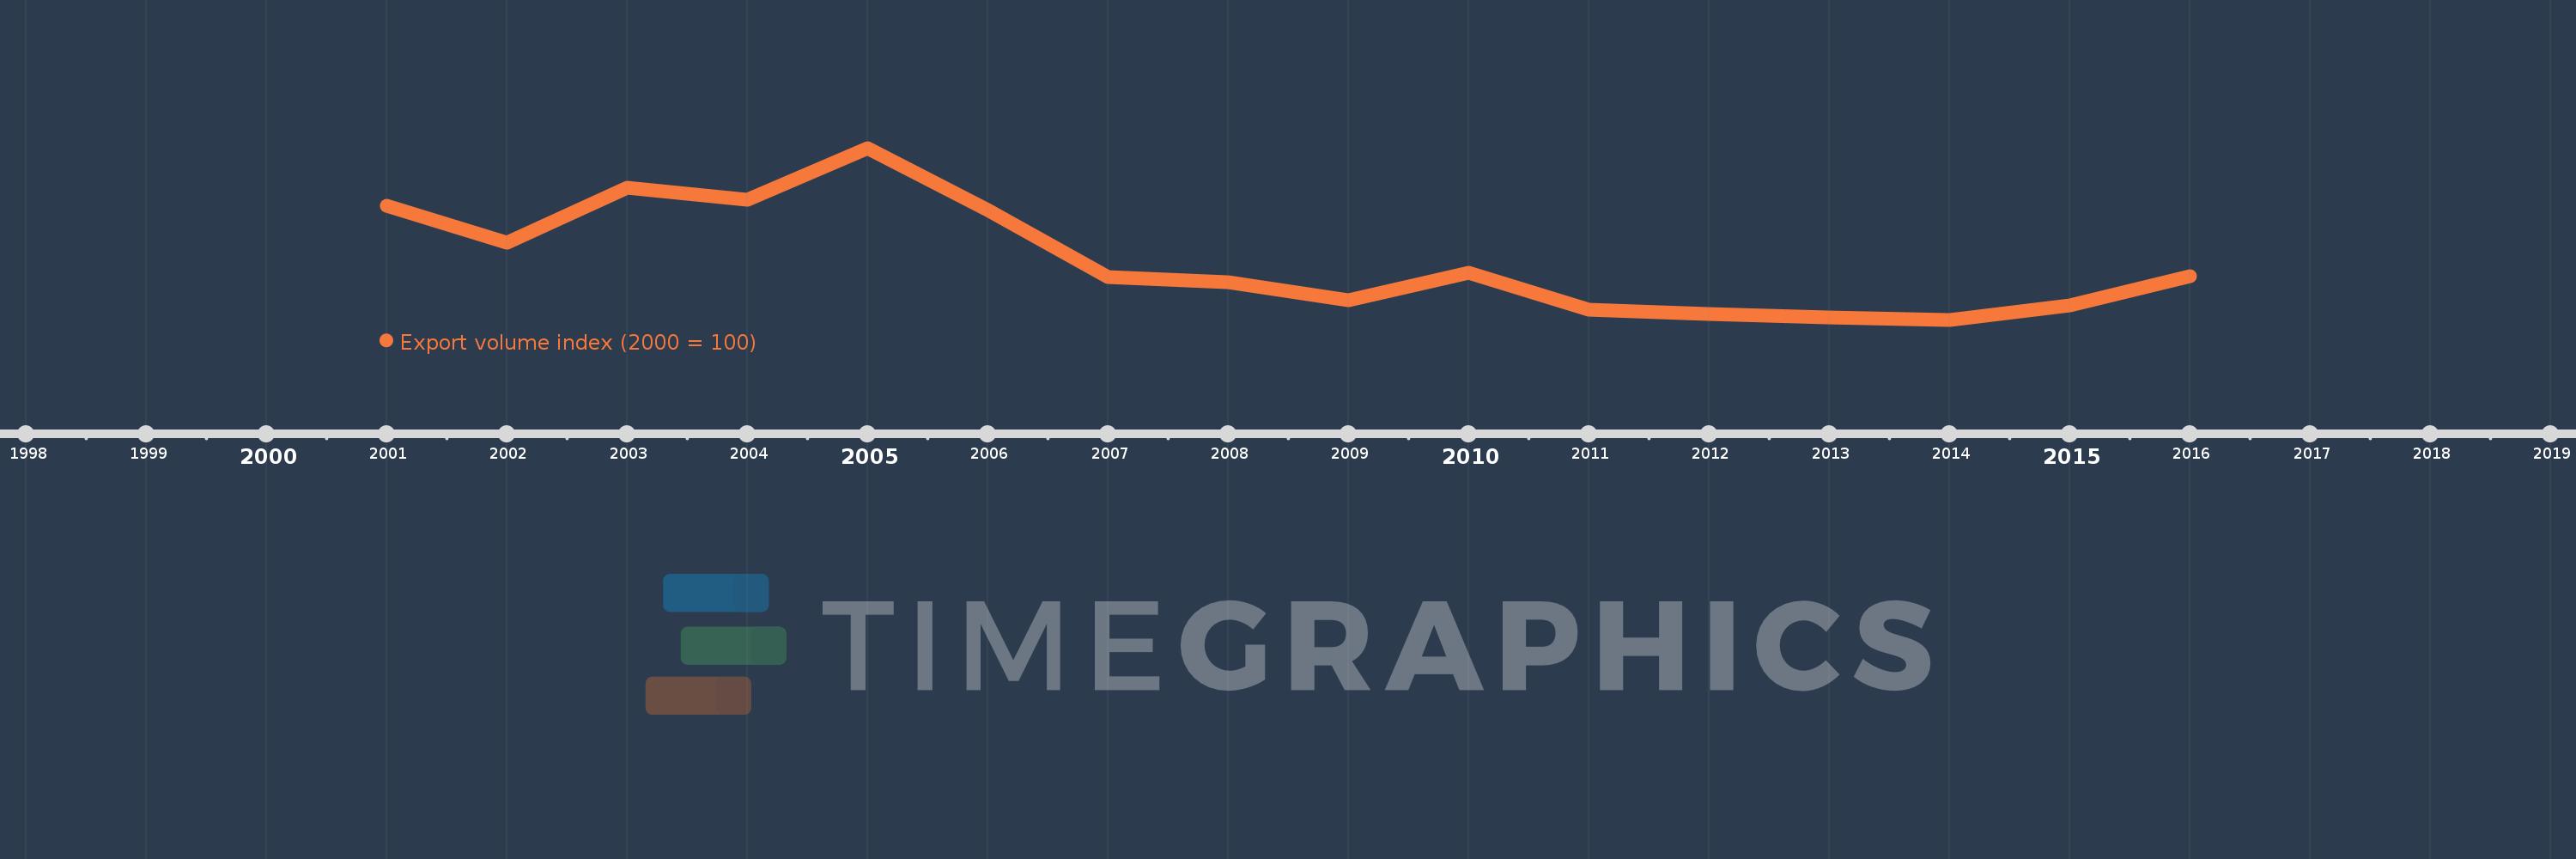
This timeline shows a graph from 2001 to 2016 of Bermuda. No data until 2000. Number of actual observations by date: 16.
Source name:
World Development Indicators
Source organization:
United Nations Conference on Trade and Development, Handbook of Statistics and data files, and International Monetary Fund, International Financial Statistics.
Categories, topics:
Private Sector, Trade
Last updated:
apr 23, 2017
Indicators value changes by year
Meaning:
59.68
Minimum:
15.927
jan 1, 2014
Maximum:
142.983
jan 1, 2005
At the date of observation
Value
Absolute change
Change from the previous value
jan 1, 2001
100.0
+100.0
0.0%
jan 1, 2002
73.091
-26.909
-26.91%
jan 1, 2003
113.617
+40.526
55.45%
jan 1, 2004
104.851
-8.766
-7.72%
jan 1, 2005
142.983
+38.132
36.37%
jan 1, 2006
96.941
-46.042
-32.2%
jan 1, 2007
47.354
-49.587
-51.15%
jan 1, 2008
43.448
-3.906
-8.25%
jan 1, 2009
30.557
-12.891
-29.67%
jan 1, 2010
50.423
+19.865
65.01%
jan 1, 2011
23.096
-27.326
-54.19%
jan 1, 2012
20.368
-2.728
-11.81%
jan 1, 2013
17.885
-2.483
-12.19%
jan 1, 2014
15.927
-1.958
-10.95%
jan 1, 2015
26.5
+10.574
66.39%
jan 1, 2016
47.84
+21.34
80.53%
Ranking of countries by current statistics by years
