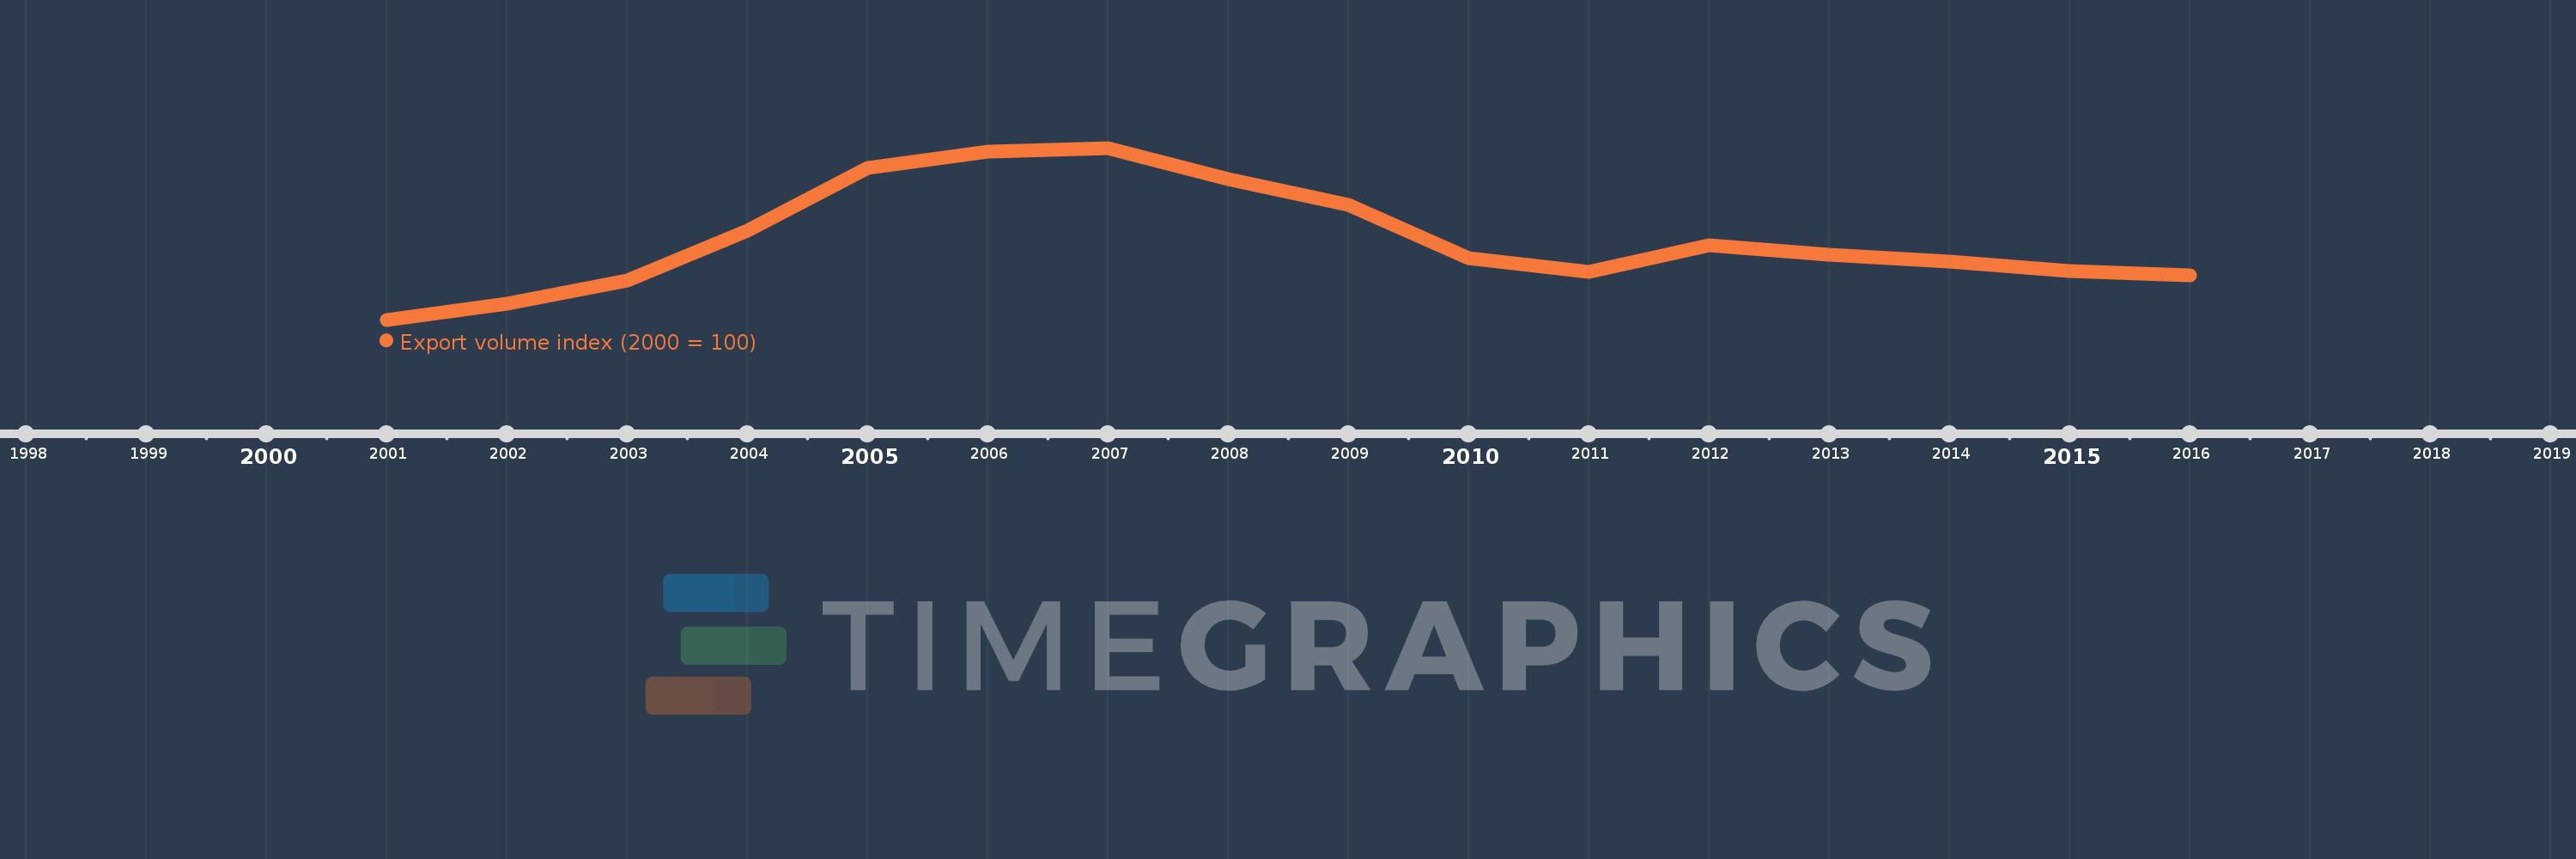
This timeline shows a graph from 2001 to 2016 of Andorra. No data until 2000. Number of actual observations by date: 16.
Source name:
World Development Indicators
Source organization:
United Nations Conference on Trade and Development, Handbook of Statistics and data files, and International Monetary Fund, International Financial Statistics.
Categories, topics:
Private Sector, Trade
Last updated:
apr 23, 2017
Indicators value changes by year
Meaning:
190.744
Minimum:
100.0
jan 1, 2001
Maximum:
293.066
jan 1, 2007
At the date of observation
Value
Absolute change
Change from the previous value
jan 1, 2001
100.0
+100.0
0.0%
jan 1, 2002
117.708
+17.708
17.71%
jan 1, 2003
144.416
+26.708
22.69%
jan 1, 2004
200.579
+56.163
38.89%
jan 1, 2005
270.362
+69.783
34.79%
jan 1, 2006
289.321
+18.958
7.01%
jan 1, 2007
293.066
+3.745
1.29%
jan 1, 2008
258.062
-35.004
-11.94%
jan 1, 2009
229.175
-28.887
-11.19%
jan 1, 2010
169.132
-60.043
-26.2%
jan 1, 2011
154.216
-14.916
-8.82%
jan 1, 2012
183.991
+29.775
19.31%
jan 1, 2013
172.872
-11.119
-6.04%
jan 1, 2014
165.063
-7.809
-4.52%
jan 1, 2015
154.27
-10.793
-6.54%
jan 1, 2016
149.67
-4.6
-2.98%
Ranking of countries by current statistics by years
